
Rice Crop Models Stabilize Global Markets, Enable Efficient Irrigation
NASA Technology
When global food prices spiked dramatically in late 2007 and into 2008, with the costs of many basic dietary staples doubling or even tripling, protests and riots upset much of the developing world. Panicked governments stopped exporting food, aggravating the crisis. Almost as troubling as the widespread unrest and hunger, though, was the fact that it had taken the world by surprise.
Following the price spike, world leaders gathered to figure out how to foresee and avert such market instabilities in the future, and a major product of those meetings was the Group on Earth Observations’ Global Agricultural Monitoring (GEOGLAM) initiative, carried out by a partnership of governments and international organizations in the G20 nations. The initiative relies primarily on satellite Earth-imaging data to improve projections of crop production and weather forecasting.
Making projections based on raw satellite data, however, is no simple task. “You have to be an expert to transform that data into useful information,” says Nathan Torbick, a director at Applied GeoSolutions, based in Newmarket, New Hampshire, which has been researching various applications for Earth-imaging satellite data for more than a decade. As far as crop projections, the company decided it would leverage its ongoing work on rice, which is the world’s most difficult major dietary staple to predict.
“There really is no rice futures market, relative to corn, soy, wheat, and wbeef,” Torbick says, noting that this is because traders don’t have reliable rice information or production forecasts on which to base such trades. This makes the rice market volatile, putting investors, producers, and, ultimately, consumers at risk. “If there’s a big drought in Thailand or other parts of Southeast Asia, hundreds of thousands of people worldwide might starve,” Torbick says.
Meanwhile, in the United States, parts of the country’s two biggest rice-producing regions are running out of water. In the Sacramento Valley area of California, which isto about half a million acres of rice fields, drought has become the new normal, Torbick says. And in eastern Arkansas, where about a million and a half acres are dedicated to rice production, areas like the Grand Prairie region sit on aquifers that have been pumped nearly dry. One solution is to use satellite data to plan water use more efficiently, Torbick says.
Among the satellites most popularly used for Earth-imaging data are the Landsat series, in orbit since 1972, and the Terra and Aqua satellites, equipped with the Moderate-Resolution Imaging Spectrometer (MODIS) instrument. Although NASA built the satellites, the U.S. Geological Survey operates each Landsat once it’s in orbit.
Landsat 8, launched in 2013, covers Earth’s surface every 16 days, capturing images in nine visible, near-infrared, and shortwave infrared bands, as well as two thermal infrared bandwidths. The thermal information is especially important for detecting crop stress and supporting crop predictions, as it reveals moisture and temperature on the land surface, in plants, and in the lower atmosphere. MODIS, meanwhile, maps Earth every one to two days in 36 visible and infrared bandwidths, providing the frequent visits needed to monitor changes in crop stages, plants’ responses to weather, and farm activities such as irrigation or tillage.
In addition to moisture and temperature observations, the imagers can detect the greenness, biomass vigor, and leaf moisture of rice plants, and the presence and depth of surface water, all useful for assessing crop health and predicting crop outcomes. By using the satellite imagery, Applied GeoSolutions can assess large areas at far less cost than traditional field visits.
Applied Geosolutions approached NASA with a plan to design Web-based software that would use current and archived data from Landsat, MODIS, and other satellites, incorporating measures of rice fields, yield modeling, and weather forecasts to generate information in real time about rice coverage, growth stages, deviation from normal, and expected yield around the globe, as well as calculate the statistical certainty of that information to address risks.
Technology Transfer
In 2012, Stennis Space Center granted the company Phase I and II Small Business Innovation Research (SBIR) contracts to create a Rice Decision Support System (RDSS), one that would inform rice-related decisions ranging from how to invest in rice futures to how to irrigate fields, where and when production risk exists, how to validate conservation practices, and when to buy, sell, or hold.
The system went into operation around the start of 2014.
In the United States, Applied Geosolutions predominantly uses Landsat and MODIS data, while in Southeast Asia it relies primarily on synthetic aperture radar (SAR) satellite data made available by governments and especially the Japan Aerospace Exploration Agency. In 2015 the company grew its use of the European Space Agency’s (ESA) Earth-imaging Sentinel platform, in addition to continuing its work with the ESA’s Phased Array Type L-Band SAR satellite and Canada’s Radarsat-2.
The various imagers have different resolutions and operate in different parts of the electromagnetic spectrum, with the RDSS overlaying all that information. “You combine all the satellites to give you a complete picture of what’s going on on the ground,” Torbick says.
Abroad, the system is focused on pilot sites in Java, Indonesia, and the Red River Delta in Vietnam, as well as in Brazil, which has recently ramped up rice production and has begun to offer incentives for sustainable crop management styles. RDSS monitors which farms are using these practices. “Tools to help monitor and validate rice-management practices will be central to developing ecosystem-services markets that will improve transparency and increase efficiency while rewarding stewardship,” Torbick says.
In Arkansas and California, Applied Geosolutions has paid partnerships with farmers and agencies to help them plan their growing season and manage resources, especially with regard to irrigation. As in Brazil, imagery gathered in the United States also proves which farms should receive incentives for using alternative irrigation methods.
The imagery from Southeast Asia is used primarily for supporting food security programs and commodity markets. In that part of the world, where rice is a major contributor to gross domestic product and supports the livelihood and diet of hundreds of millions of people, Torbick says, agriculture faces major challenges in the coming decade due to increasing resource pressures, weather and climate change, population growth, shifting diets, and economic development.
Historically, global rice production has been difficult to predict because this region, where the overwhelming majority of the world’s rice supply is produced, is too cloudy for conventional satellite imaging. SAR imaging technology helps overcome that problem, as it is able to detect vegetation structure and moisture content through cloud cover.
Benefits
Applied Geosolutions’ system now supports the GEOGLAM initiative, helping it to supply producers, buyers, and investors around the world with more comprehensive information and projections about what was, as of 2012, the second-most produced crop in the world.
“GEOGLAM allows countries and regions to make a better assessment of what the harvest will be, so they can do things like put out the right loans and buy the food when they should,” says Bradley Doorn, program manager for the Water Resources Applied Sciences program in NASA Headquarters’ Earth Sciences Division. Waiting for a crisis drives up prices, while buying and storing beforehand can avoid disaster, he says. “When we’re blind to what production will be, the market becomes speculative, and volatility prevails. This is not good for business, government, or consumers.”
In these cases, the only ones who benefit are those who happen to guess correctly—usually not the farmers, he says. But with solid information, farmers can predict what prices will be and make sound decisions about when to sell. “It’s that whole give and take of the market that it’s going to support.”
By reducing risk for investors and producers, Torbick says, the RDSS can help stabilize global rice markets and blunt future price upheavals. “It’s really a risk-management tool.”
“Adding the rice capability was huge, because it just has such an impact on the world and on the populace,” says Doorn.
The system could also be used to help inform programs like the U.S. Agency for International Development’s Famine Early Warning System, which uses this sort of data to predict regional food crises and decide how much food aid will be needed and when and where to buy the food, he says. “They’re making those decisions constantly.”
Another reason Applied Geosolutions chose to monitor rice is that the crop is a major driver of greenhouse gases. The saturated soil of inundated rice paddies leads to anaerobic decomposition of organic material, which produces methane, a greenhouse gas 20 to 30 times more powerful than carbon dioxide. The company is doing some work in Vietnam, California, and Arkansas, in part supported by NASA’s Land-Cover/Land-Use Change Program, to support alternative rice management strategies and to explore the possibility of wealthier countries paying developing countries to use environmentally sound farming practices.
Meanwhile, in the United States, a primary RDSS application is water management. “If we can help them reduce water usage, that’s a big help because they’re running out of it,” Torbick says, noting that rice acreage in California dropped by 25 percent in 2014 due to lack of water, a trend the RDSS had predicted and mapped in real time.
In northern California, most rice fields are flooded prior to seeding, a process called wet seeding, but as water availability continues to decline, there’s been increased need for conservation. Using satellite images, the company can determine whether a field needs to be watered, how much water it needs, and whether wet seeding is even necessary. “If you can do dry seeding without reducing your yield much, you could potentially offset yield costs by reducing pumping costs,” Torbick says. “We can say where that might work, and we can model yield.”
In Arkansas, the company is helping farmers implement a water-saving irrigation method known as alternate wetting and drying. “We can optimize watering by looking at weather, soil moisture, and crop conditions across Arkansas,” Torbick says, adding that historical data, weather predictions, and measures of soil moisture let Applied Geosolutions tell a farmer pretty precisely how much water a field needs at a given time. Fifty farms there are partnering with Applied Geosolutions, letting Torbick use measurements from moisture sensors in their fields to calibrate data points from imaging satellites.
Torbick notes that techniques like alternate wetting and drying could one day be implemented in many locations around the world.
The company also helps to inform the U.S. Department of Agriculture’s National Agricultural Statistics Service, which publishes about 5,000 national statistical reports and thousands of state reports each year. “They have a big mission, so if we can help them do that in real time, with better sensors, that’s great,” Torbick says.
In the United States, the company is able to predict rice extent with 90 to 95 percent accuracy six weeks into the growing season, he says, adding that accuracy is about 85 to 90 percent at pilot sites overseas. “By mid-June, I’ll tell you how much area is going to get harvested in September. We combine extent forecasts with yield predictions and statistical modeling from past conditions to manage risk.”
For 2015, the company planned to make some basic predictions available free of charge and provide more detailed information to paying customers in the United States.
“The value to NASA is people using our data robustly, rather than just for basic research,” Doorn says. “Doing that for rice and other commodities, there’s going to be an unlimited number of people who are interested, in the United States and globally.” In addition to the obvious players, these range from tractor companies to infrastructure planners and United Nations representatives, he says.
With NASA’s Soil Moisture Active Passive observatory and the international Global Precipitation Measurement Core Observatory both taking to the skies in the last two years and more imagers on the horizon, Doorn says Applied Geosolutions’ work is probably only the beginning of the sort of predictions these satellites will enable.
“I think it’s tremendous, and it’s a great way of utilizing not only NASA data but also the research we’ve done on this data,” he says.
“It’s a competitive world out there, so getting dollars to do this kind of research and prototyping in the early stages has been pretty critical to just getting operational,” Torbick says. “NASA builds many opportunities and businesses and provides a service for the greater good.”
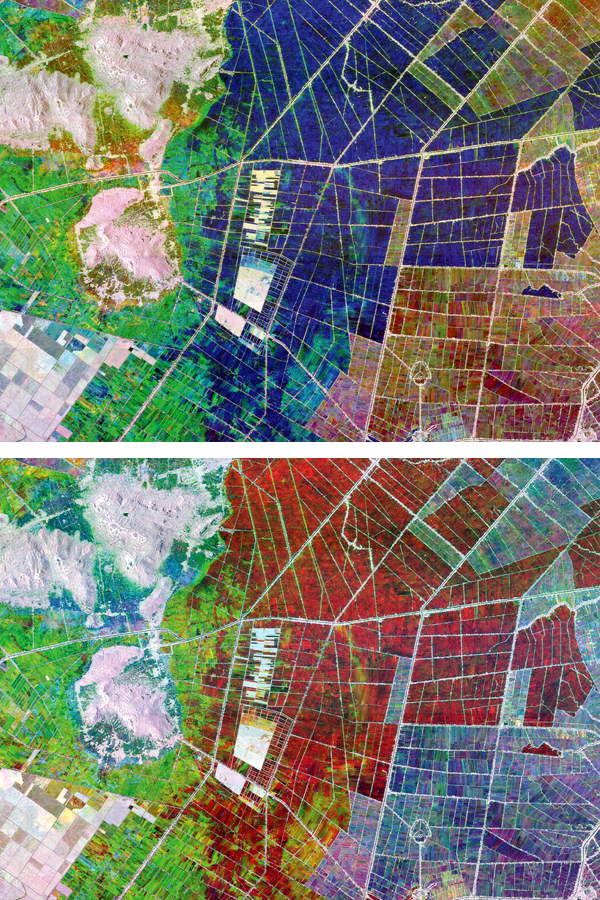
These two satellite images depict the An Giang Province in Vietnam’s Mekong Delta, a major rice-producing region, at different times of year. Dark blue and black areas are inundated and have low biomass, while white and gray areas are other crops like row crops and trees. The differences in color indicate a change in the ratio between soil moisture and biomass.
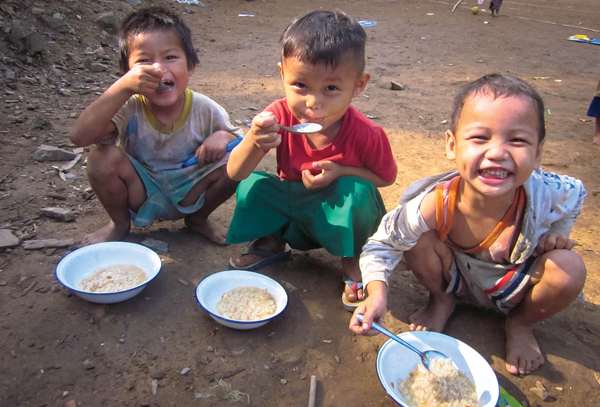
By making rice harvests easier to predict, Applied Geosolutions’ Rice Decision Support System will bring stability to the rice market, blunting food shortages that tend to hit developing countries especially hard. The system could also help inform programs like the U.S. Agency for International Development’s Famine Early Warning System, which can use the data to predict regional food crises and decide how much food aid will be needed and when and where to buy it.. Image courtesy of Feed My Starving Children, CC BY 2.0
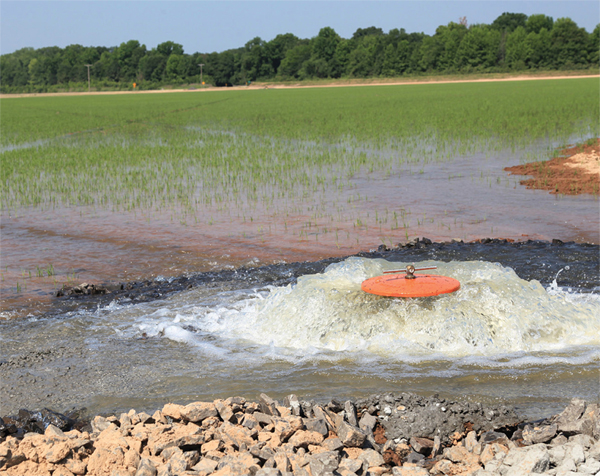
A rice paddy in Arkansas, one of the United States’ biggest rice producers, is flooded by an irrigation system. Here and in California, Applied Geosolutions’ Rice Decision Support System is being used to help farmers plan their growing season and implement water-saving irrigation methods without decreasing their yields.. Image courtesy of the U.S. Department of Agriculture
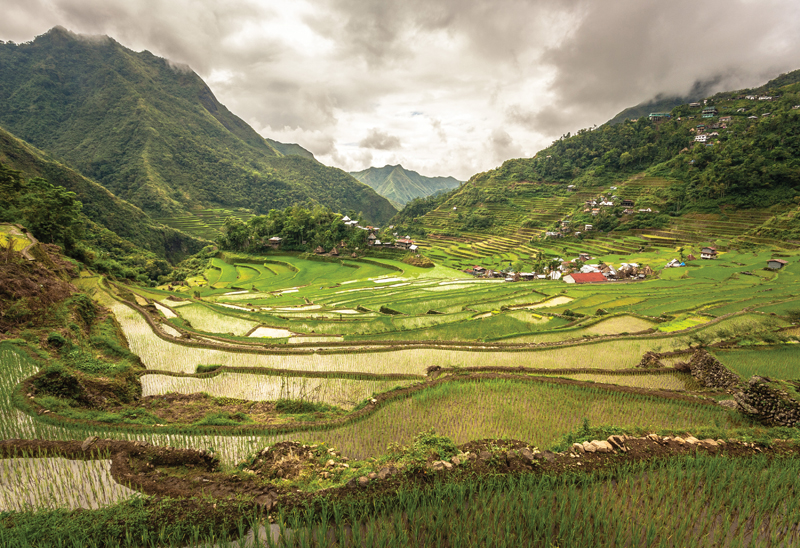
Rice is one of the most heavily produced food crops in the world, but it is one of the most difficult to predict, with yields often depending on weather. The Philippines’ famed Banaue Rice Terraces, pictured here, dried up completely in 2010. Applied Geosolutions’ Rice Decision Support System, which it developed with NASA funding, will use imagery from various satellites to make more accurate predictions, helping to stabilize the world’s rice markets. Image courtesy of Adi Simionov, CC BY-SA 3.0