
NASA Engineers Help Create A Virtual World of Data
Subheadline
NASA developments, experience, and patents lead to a new method of exploring and visualizing data in virtual reality
For almost as long as it’s been a concept, NASA has been on the cutting edge of virtual reality (VR) technology. However, the space has seen a renaissance since the bulky headsets of the 1990s. Several high-profile companies now use VR for immersive video games and virtual chat rooms, but to some, this technology has a use beyond entertainment.
NASA’s Jet Propulsion Laboratory in Southern California has been trying to improve data visualization for decades. When pictures come back from an alien world, scientists usually survey the environment with a panoramic photo, but this method has limitations. When observing a flat image, judging distances can be difficult.
“Looking at pictures on a screen is a much different experience than walking through a canyon,” said Scott Davidoff, manager of the Human Centered Design Group at JPL.
Davidoff began experimenting with VR using image data from the Curiosity rover on Mars. There had been attempts to solve the visual distance issue, like using 3D imagery viewable with red and blue filtered glasses, but nothing made scientists feel like they were really there. Davidoff and his colleagues decided to wrap the panorama around the scientist in a virtual environment. Geologists using VR in this way reported feeling like they were in the real Martian environment. They could ascertain the distance and size of features much more quickly and accurately than they could with a flat display, which sparked another idea. Davidoff thought that if viewing imagery in VR helped, it could be a game changer for more complex “multi-dimensional” data.
“When you look at a network diagram as a system in 3D, it turns out your perception does something different,” Davidoff said. “We made a data world where an analyst could look at any science or engineering problem and see patterns and correlations more clearly than they can in a flat version.”
At the same time, Ciro Donalek and George Djorgovski at the California Institute of Technology (Caltech) were researching how to use immersive environments for scientific data visualization and collaboration.
The three of them teamed up to create software that uses 3D visualizations to examine relationships between points of data. Much like how viewing a three-dimensional Martian panorama allows for better interpretation, seeing data in virtual space makes spotting correlations easier.
Obtaining an exclusive license from Caltech, which manages JPL, Donalek, Djorgovski, and new CEO Michael Amori founded Virtualitics Inc. of Pasadena, California, in 2016, with Davidoff in an advisory role. To further build out the software, they’ve incorporated features such as artificial intelligence to point out patterns and relationships in the visualized data.
“We call it intelligent exploration. You’re using AI and 3D visualizations to quickly identify drivers and relationships in your data, and drive understanding in ways 2D graphs aren’t capable of,” Donalek, now CTO of Virtualitics, said. “You can start getting insights from your data right away because it’s literally drag and drop.”
The software works on both desktop and VR and is compatible with several popular headsets. While the platform is designed for use anywhere there’s a significant amount of data, it is currently most often used in banking, retail, and medical research. It can visualize anything from a spreadsheet to a large “data lake” without having to move the data from where it resides. Donalek said the company maintains a relationship with JPL, and many of its 60 employees come from the center or Caltech.
“One of them is from MIT, but we don’t hold it against him,” Donalek joked.
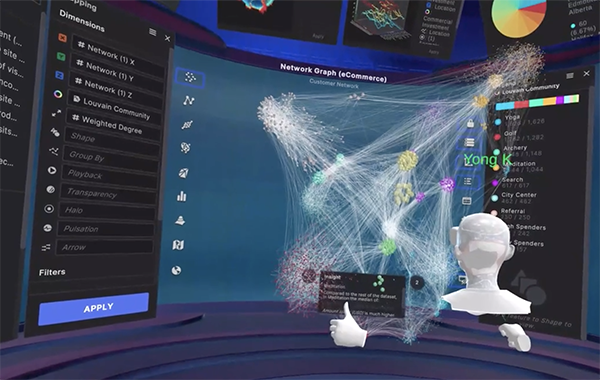
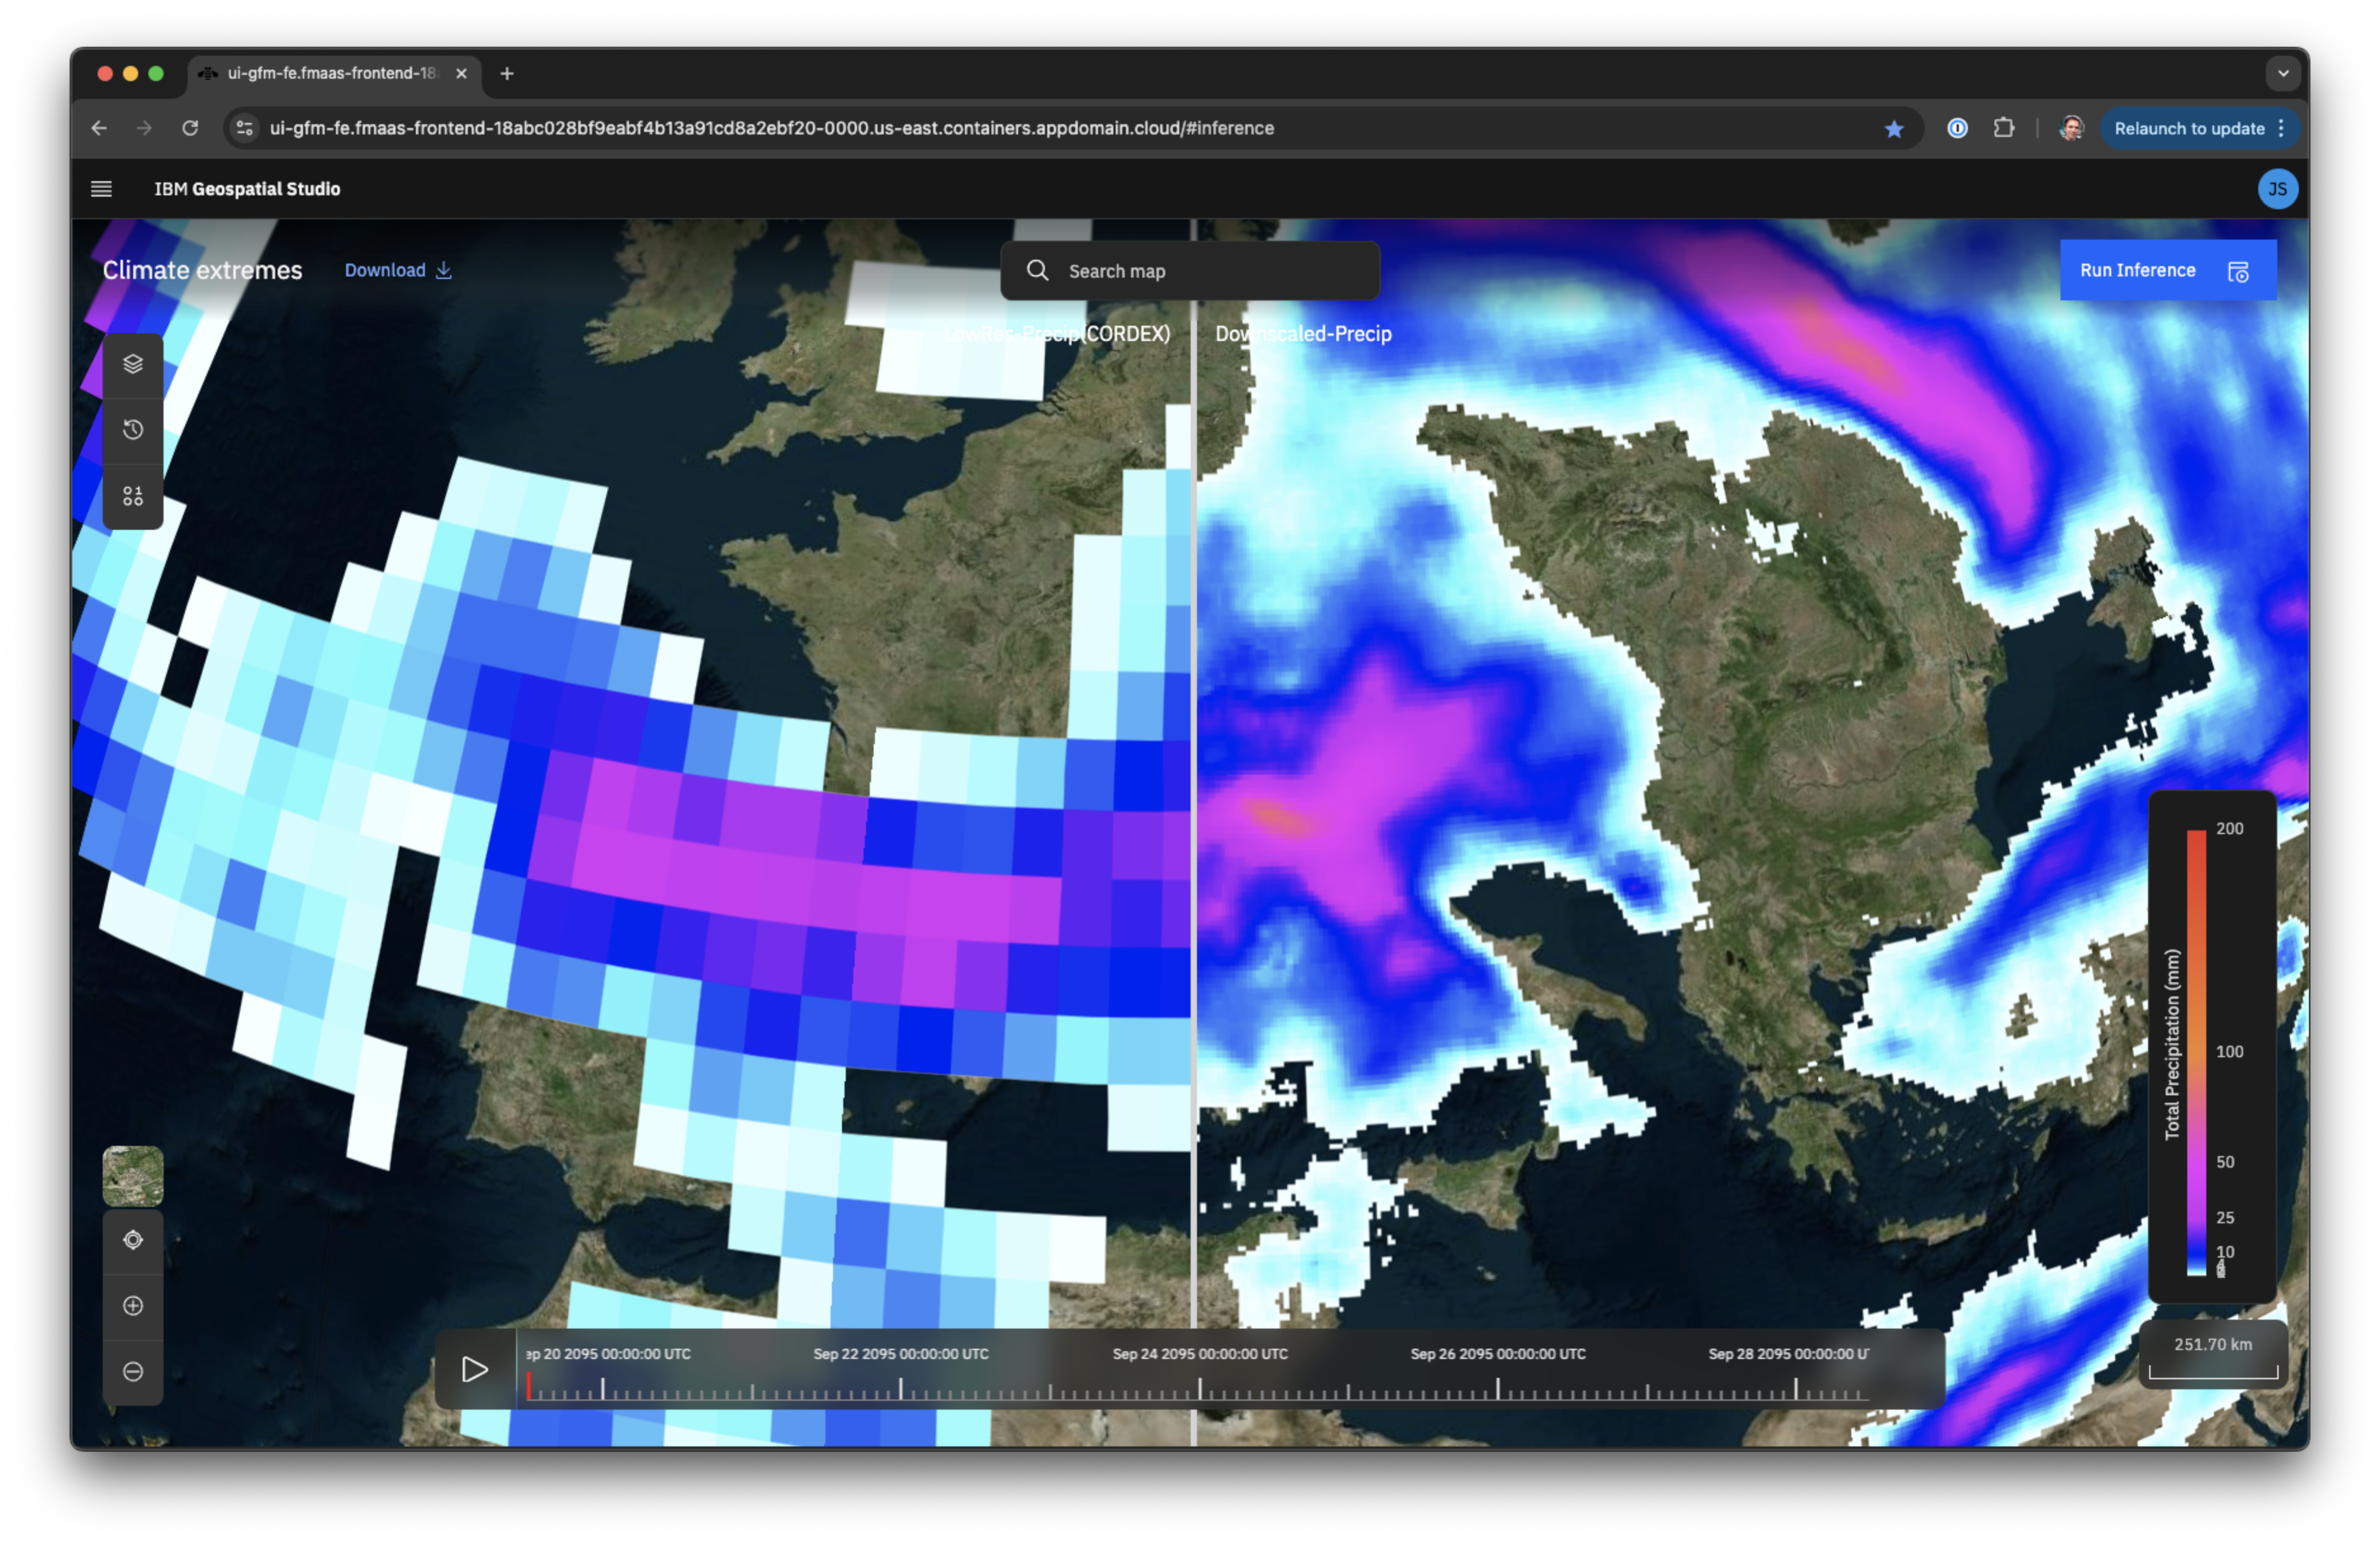
A researcher examines a data cloud in a virtual world created by Virtualitics software. NASA scientists need to sift through massive amounts of data generated by deep space missions. Efforts at NASA’s Jet Propulsion Laboratory to use virtual reality to assist in this analysis led to the creation of Virtualitics. Credit: Virtualitics Inc.
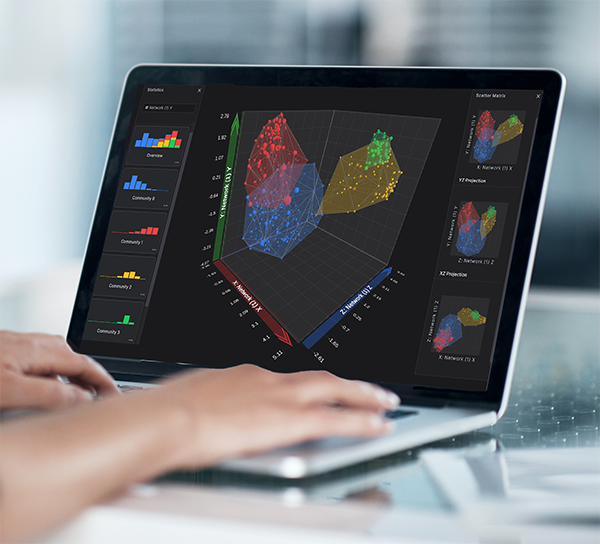
The Virtualitics software also has a desktop mode for analyzing data. Even without a virtual reality headset, the ability to visualize data in 3D space helps scientists get a better grasp on the raw information they receive. Credit: Virtualitics Inc.
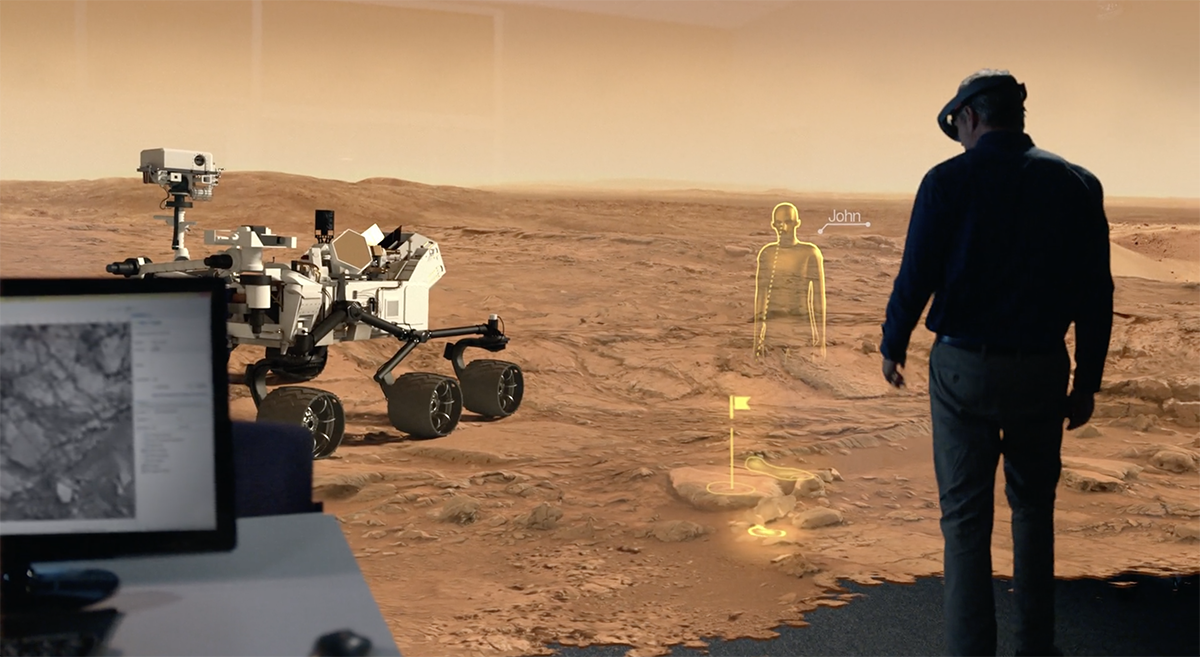
JPL has experimented with virtual and mixed-reality environments as ways to improve data analysis, particularly when it comes to judging the size and distance of geological features as seen from Mars rovers. These experiments were some of the initial tests that inspired the founders of Virtualitics to see how this technology could be used outside JPL. Credit: NASA