

A High-Tech Farmer’s Almanac for Everyone
Subheadline
NASA satellite data and climate modeling supports the development of crucial climate-resilience tools
For long-term weather predictions, the Farmer’s Almanac was a go-to source after it started publishing in 1818. Its forecasters based their predictions on the tides, alignment of the planets, and other factors, but one variable they didn’t have to contend with was the unpredictability of a warming planet.
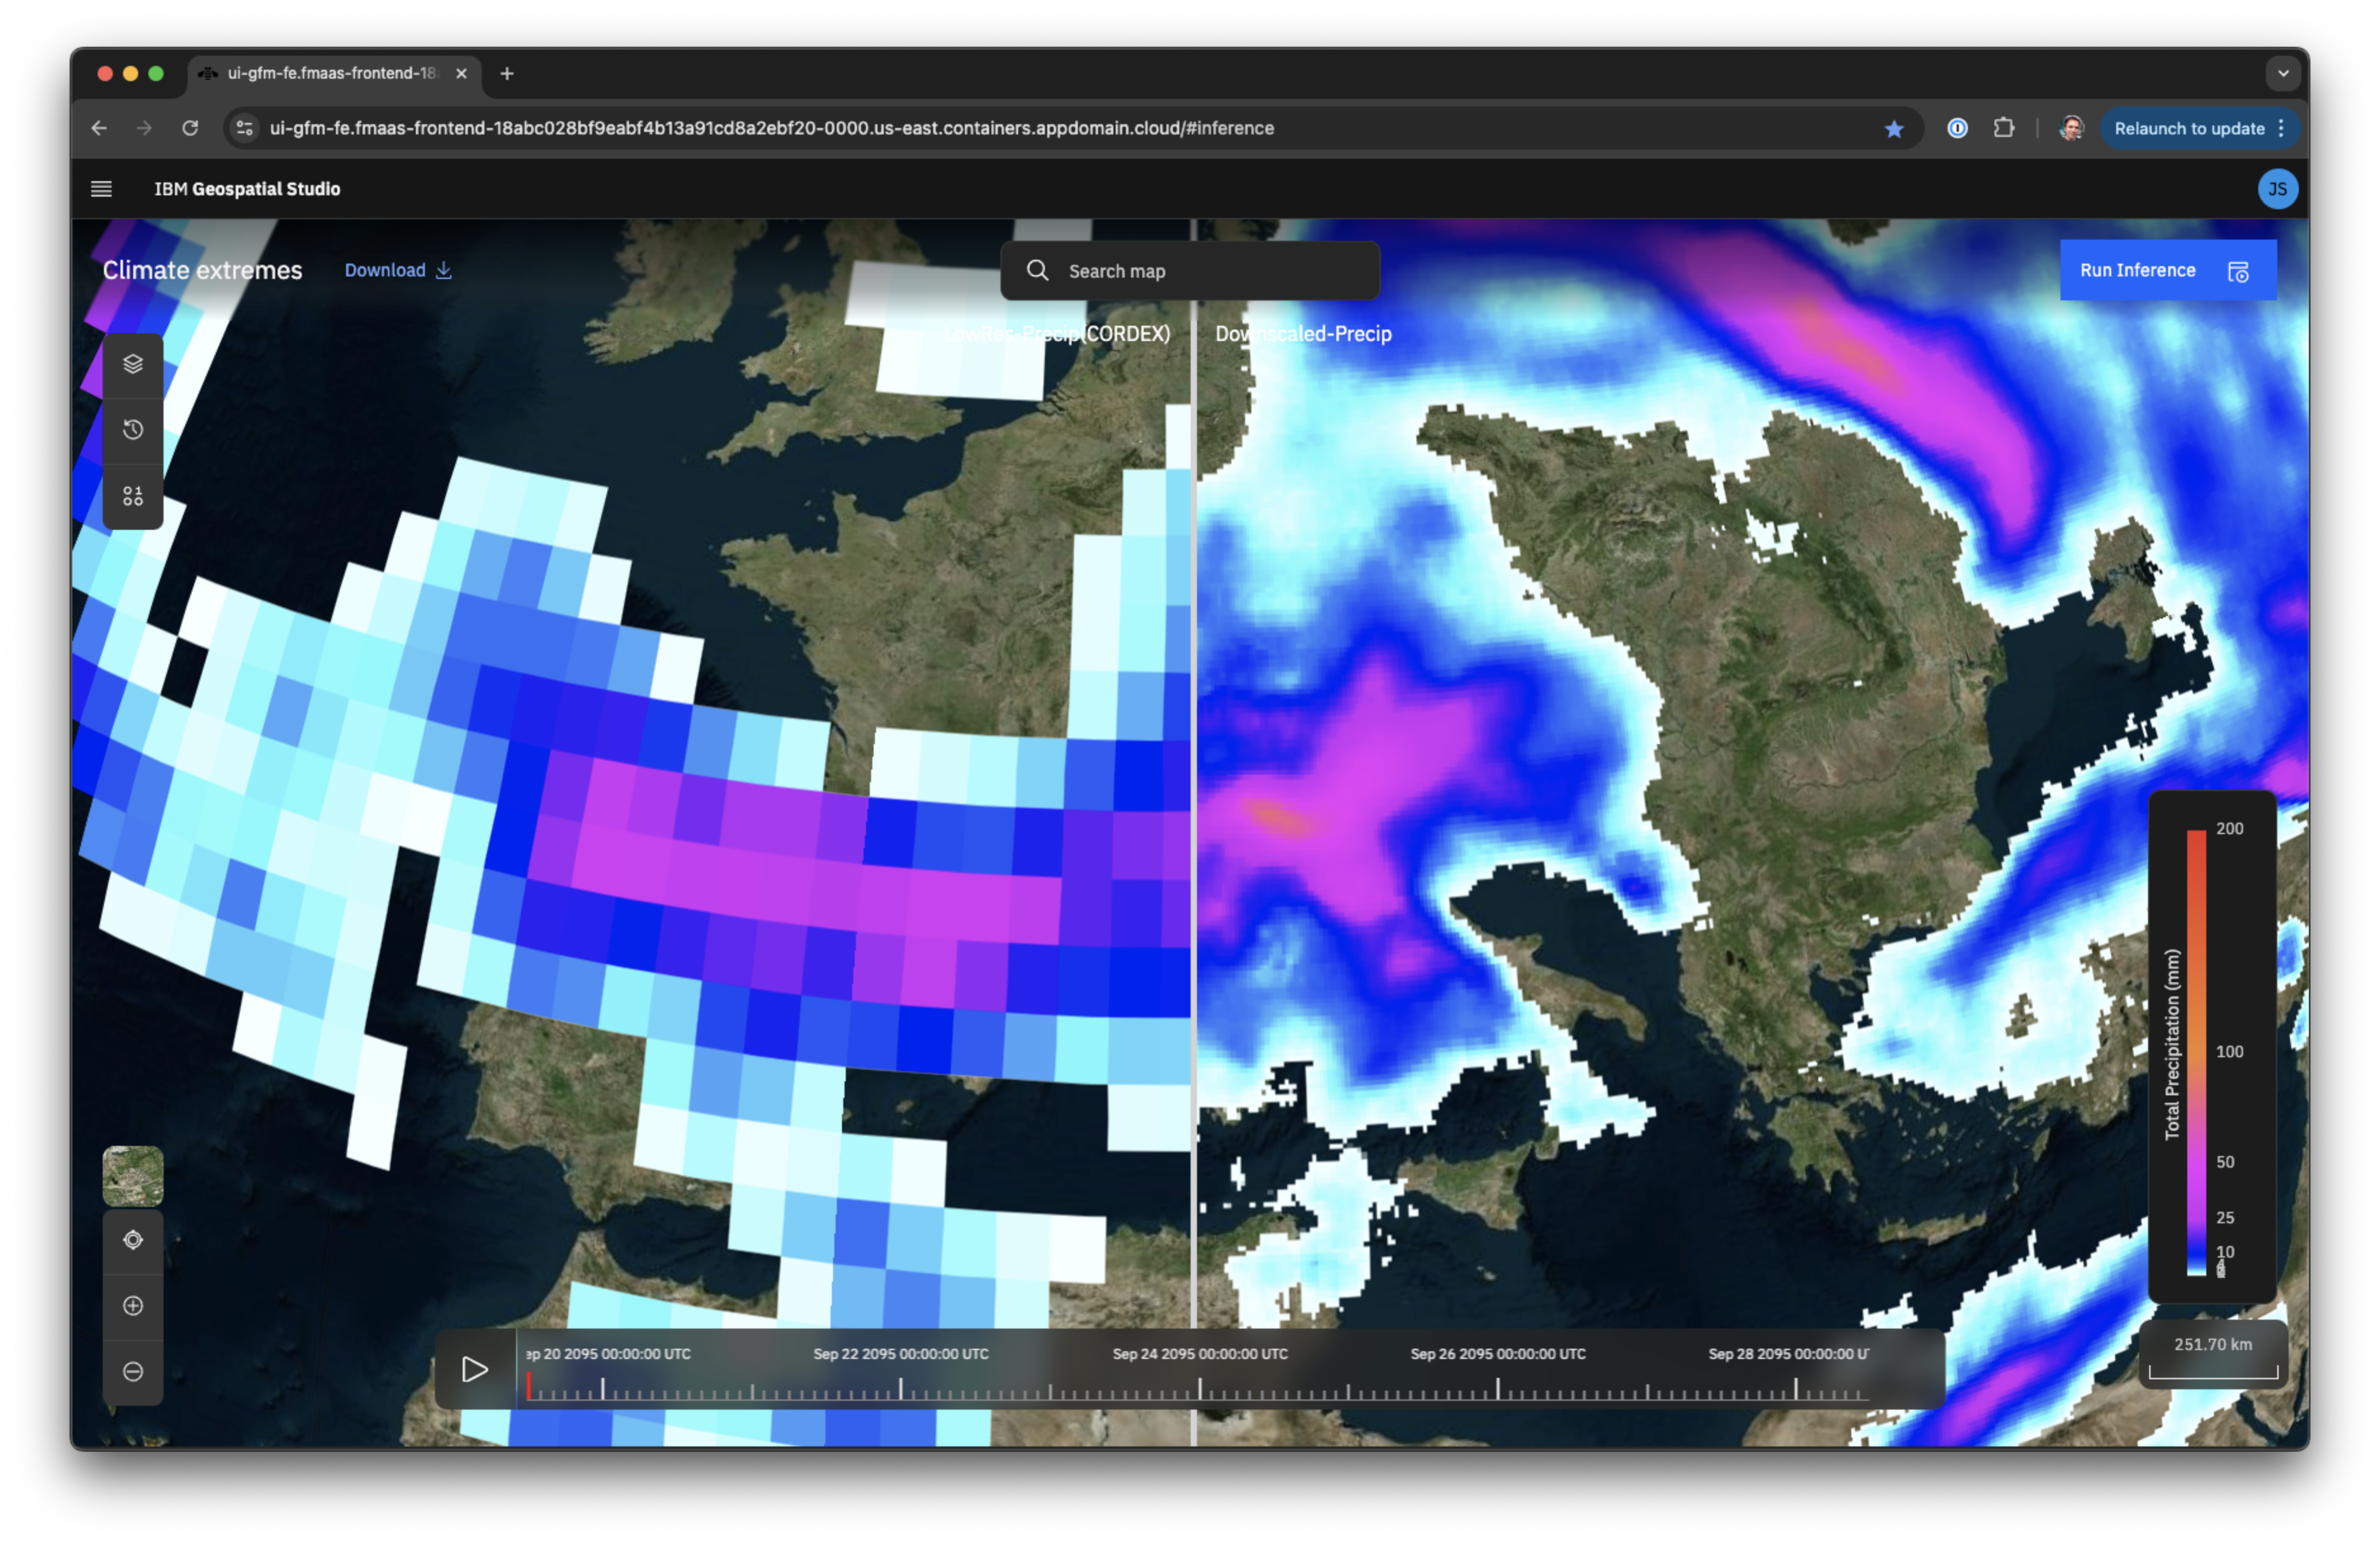
Today, companies and agencies trying to understand how climate change might alter weather patterns in the years ahead rely on NASA’s Earth-observation satellite data, analytics, and climate science to support new approaches to long-term forecasting.
Climate change is leading to stronger, more intense storms, record-breaking droughts, flooding, and more widespread wildfires. By combining data about current conditions and previous weather patterns, much of which is gathered by NASA-built satellites, computer models generate science-based predictions to help everyone from government planners to farmers, schools, and manufacturers prepare for what’s to come. These resources are essential for saving lives and limiting property damage.
The first Landsat satellite launched by NASA to observe our planet 50 years ago was the starting point for 77 more Earth-observing satellite missions, which have now amassed petabytes of data. This data is primarily managed by NASA’s Ames Research Center in Silicon Valley, California, and Goddard Space Flight Center in Greenbelt, Maryland. NASA has also built tools to apply this mountain of data to climate-related challenges.
Central to the space agency’s effort to make its trove of remote sensing data available and useful to the public is the NASA Earth Exchange (NEX) platform built around 2010. NEX provides the public with software and supercomputing power to analyze and share petabyte-scale datasets, letting everyday users conduct in-depth research.
Private companies now use these resources to bolster climate resilience – the ability to prevent, respond to, withstand, and recover from climate-related disruptions – for themselves, clients, and the public at large. Together, these efforts are turning satellite data into a modern, high-tech Farmer’s Almanac.
‘Flying Blind’ into the Future
For half a century, NASA has built constellations of Earth-observing technology. These catalog physical surface changes, temperature fluctuations, greenhouse gases, and much more.
For a long time, though, that data was difficult to access. Before the internet, anyone requesting information needed to know NASA research programs, available datasets, and individual investigators. The time it took to track down that information and submit requests, as well as the expertise to compile datasets, was expensive, even if the data was free. And it often was not. Prior to 2008, for example, Landsat data could be prohibitively expensive.
“When I worked a summer job at Goddard, pulling data meant we had to transfer it from tapes onto a mainframe or workstation,” recalled Beau Legeer, who is now director of imaging and remote sensing for Esri Inc. of Redlands, California. To make that data more accessible, NASA needed a way to extract it from multiple sensors and many different file types, so the agency partnered with the private sector.
In 2010, Esri created the data model for online access to Earth-observation data. NASA-developed algorithms were used to automatically find and compile geographical data from any server. All Earth data correlates to locations, so geography was the best way to organize the information using the geographic information system (GIS). If a researcher needed 40 years’ worth of daily high temperatures for Chicago, for the first time, it was easy to collect that data regardless of how and where it was stored.
The agency again partnered with Esri, as well as the U.S. Geological Survey and Amazon Web Services, to move the data to the cloud, making it searchable by anyone. This easy access opened the door to cost-effective, innovative ways to use data.
“One of the most powerful capabilities we can offer is a continuous global view of our planet,” said Dalia Kirschbaum, hydrological sciences lab chief at Goddard. She explained how her team worked with stakeholders including a group in Tajikistan to develop the algorithms to use data for any location around the world to populate an open-source landslide model.
A computer model can identify critical infrastructure, homes, and businesses placed at risk by a changing climate. ArcGIS, the online cloud-based mapping and analysis service Esri developed, supports the landslide program and other climate-modeling efforts at NASA and elsewhere.
With these tools, targeted planning and prevention measures for climate-driven challenges become possible. Creating a rain garden might help a school that never had a flood problem before, for example, while changes to construction practices can help weatherproof homes and businesses to protect people and reduce property damage.
“Without the observations of land, precipitation, the atmosphere, and our oceans, we would be flying blind in terms of what trends have been and how we can improve our models for the future,” said Kirschbaum.
In addition to offering free ArcGIS licenses to developing countries, Esri has customers using its data-mapping tools to evaluate climate-related risks at facilities around the world. According to Legeer, construction industry customers, for example, evaluate how to modify a site plan by modeling the impacts of terrain and climate.
Water, Water Everywhere
Localized flood risk calculations in the United States rely on federal flood maps. They aren’t always available, and many are out of date, said Dr. Ed Kearns, chief data officer with First Street Foundation. The Brooklyn, New York-based nonprofit realized that situation made it difficult for homeowners, insurers, real estate agencies, and property developers to obtain accurate risk information about specific addresses.
First Street’s goal is to raise awareness about the impacts of climate change and the associated risks. Flooding is the nation’s most expensive natural disaster, having cost over $1 trillion (in inflation-adjusted dollars) since 1980, according to the foundation.
“We’re integrating research results from government and open data models and working with commercial and academic partners to assemble the puzzle pieces required to understand climate change,” said Kearns.
Launched in 2020, First Street’s Flood Factor program combines multiple data sources such as NASA downscaled climate models, Earth-observation data, topography, and more to predict the impact of rainfall, storm surges, and other potential flooding events.
The program assesses potential impacts of various climate conditions – the once-dry areas that could soon experience flooding or the impact of flooding from an overtopped levee and the likelihood of these events occurring. With this information, property owners can limit damage.
First Street customers like realtor.com, Estately, and Redfin integrate Flood Factor into their websites, allowing users to quickly identify risk. With awareness growing about the way extreme storms are shifting flood risk, Kearns said businesses are recognizing the need to make data-driven decisions.
Because climate change poses multiple threats, First Street is developing more risk models. Wildfire modeling is due out in 2022. Along with a forthcoming extreme heat assessment, these services are free to the public.
World on Fire
What happens when the insurance industry tries to assess fire risk using standards developed before climate change intensified wildfires? Higher premiums, according to Shanna McIntyre, chief data officer of Delos Insurance Solutions.
The San Francisco company’s custom wildfire modeling program uses “hundreds of parameters” including NASA Earth-observation imagery, datasets like NASA’s LANDFIRE, and the most current climate science to calculate risks before pricing insurance policies.
“Artificial intelligence allows us to use far more variables, and the use of more datasets does a much better job of predicting an outcome,” she said. For example, she explained, satellite imagery combined with other data sets help the model “learn” where and how wildfire risk is changing.
The risk for each property is ranked, and the company shares what it learns with the property owner, providing specific steps to reduce the likelihood of losses.
In the last three years, wildfire insurance premiums have risen 400% in many parts of California, according to Delos. But the company has been able to step in when property owners lose their coverage or can no longer afford it. Modeling the risk over time means the company better understands what will happen in a location, avoiding unexpected price hikes that occur under the old method, said McIntyre.
The company, which only operates in California, is scaling up to serve Oregon and Washington state. Delos will eventually offer its program worldwide to calculate growing wildfire risks in places that have never had to deal with them.
An Ounce of Prevention
Businesses are always managing risk but don’t always have access to the latest information, according to Bob Miller, CEO of Tenefit Corporation. International companies frequently operate a global security operation center, or GSOC, which monitors events that threaten business activities, such as hurricanes, volcanic eruptions, and other natural disasters. That’s why San Jose, California-based Tenefit developed DisasterAWARE Enterprise.
This multi-hazard monitoring system provides early warnings and near-real-time updates as disasters develop. The service also predicts impacts, develops risk assessments, and offers other resources that rely on climate science along with NASA data, analytics, and modeling code.
DisasterAWARE Enterprise is built on the public-serving DisasterAWARE platform developed and owned by the Pacific Disaster Center, which is managed in partnership with the University of Hawaii. A license from the university has allowed Tenefit to extend the platform to meet private-sector needs. Tenefit also helped to scale up the center’s smartphone app, Disaster Alert.
In addition to creating the app and providing cloud storage for this vast amount of data, DisasterAWARE Enterprise lets subscribers, such as global distribution companies, track risks to specific properties. Warnings for manufacturing plants or key suppliers are accessed via a web portal or the Disaster Alert app. A license for the program can feed all of this information directly into any GSOC.
DisasterAWARE uses the landslide prediction tool Kirschbaum’s team developed at Goddard and will incorporate a NASA-developed global flood model when it’s available in 2022.
The New Future
Whether faced with fire, flood, or extreme heat in the United States or other countries, NASA has key data and modeling capabilities to address these global challenges. Long-term monitoring of Earth from space will expand and maintain robust data records.
“We need to understand how things have changed in the past decades so that we can effectively model changes in the future,” said Kirschbaum. NASA and other government environmental data is available at no cost, and the agency is pursuing the use of more open-source analytical tools to enable the easiest access to this high-tech Farmer’s Almanac for everyone to use free of charge.
“At NASA and as scientists, our goal is to connect the science to societal impacts, to understand where we can make changes to become more resilient,” said Kirschbaum.

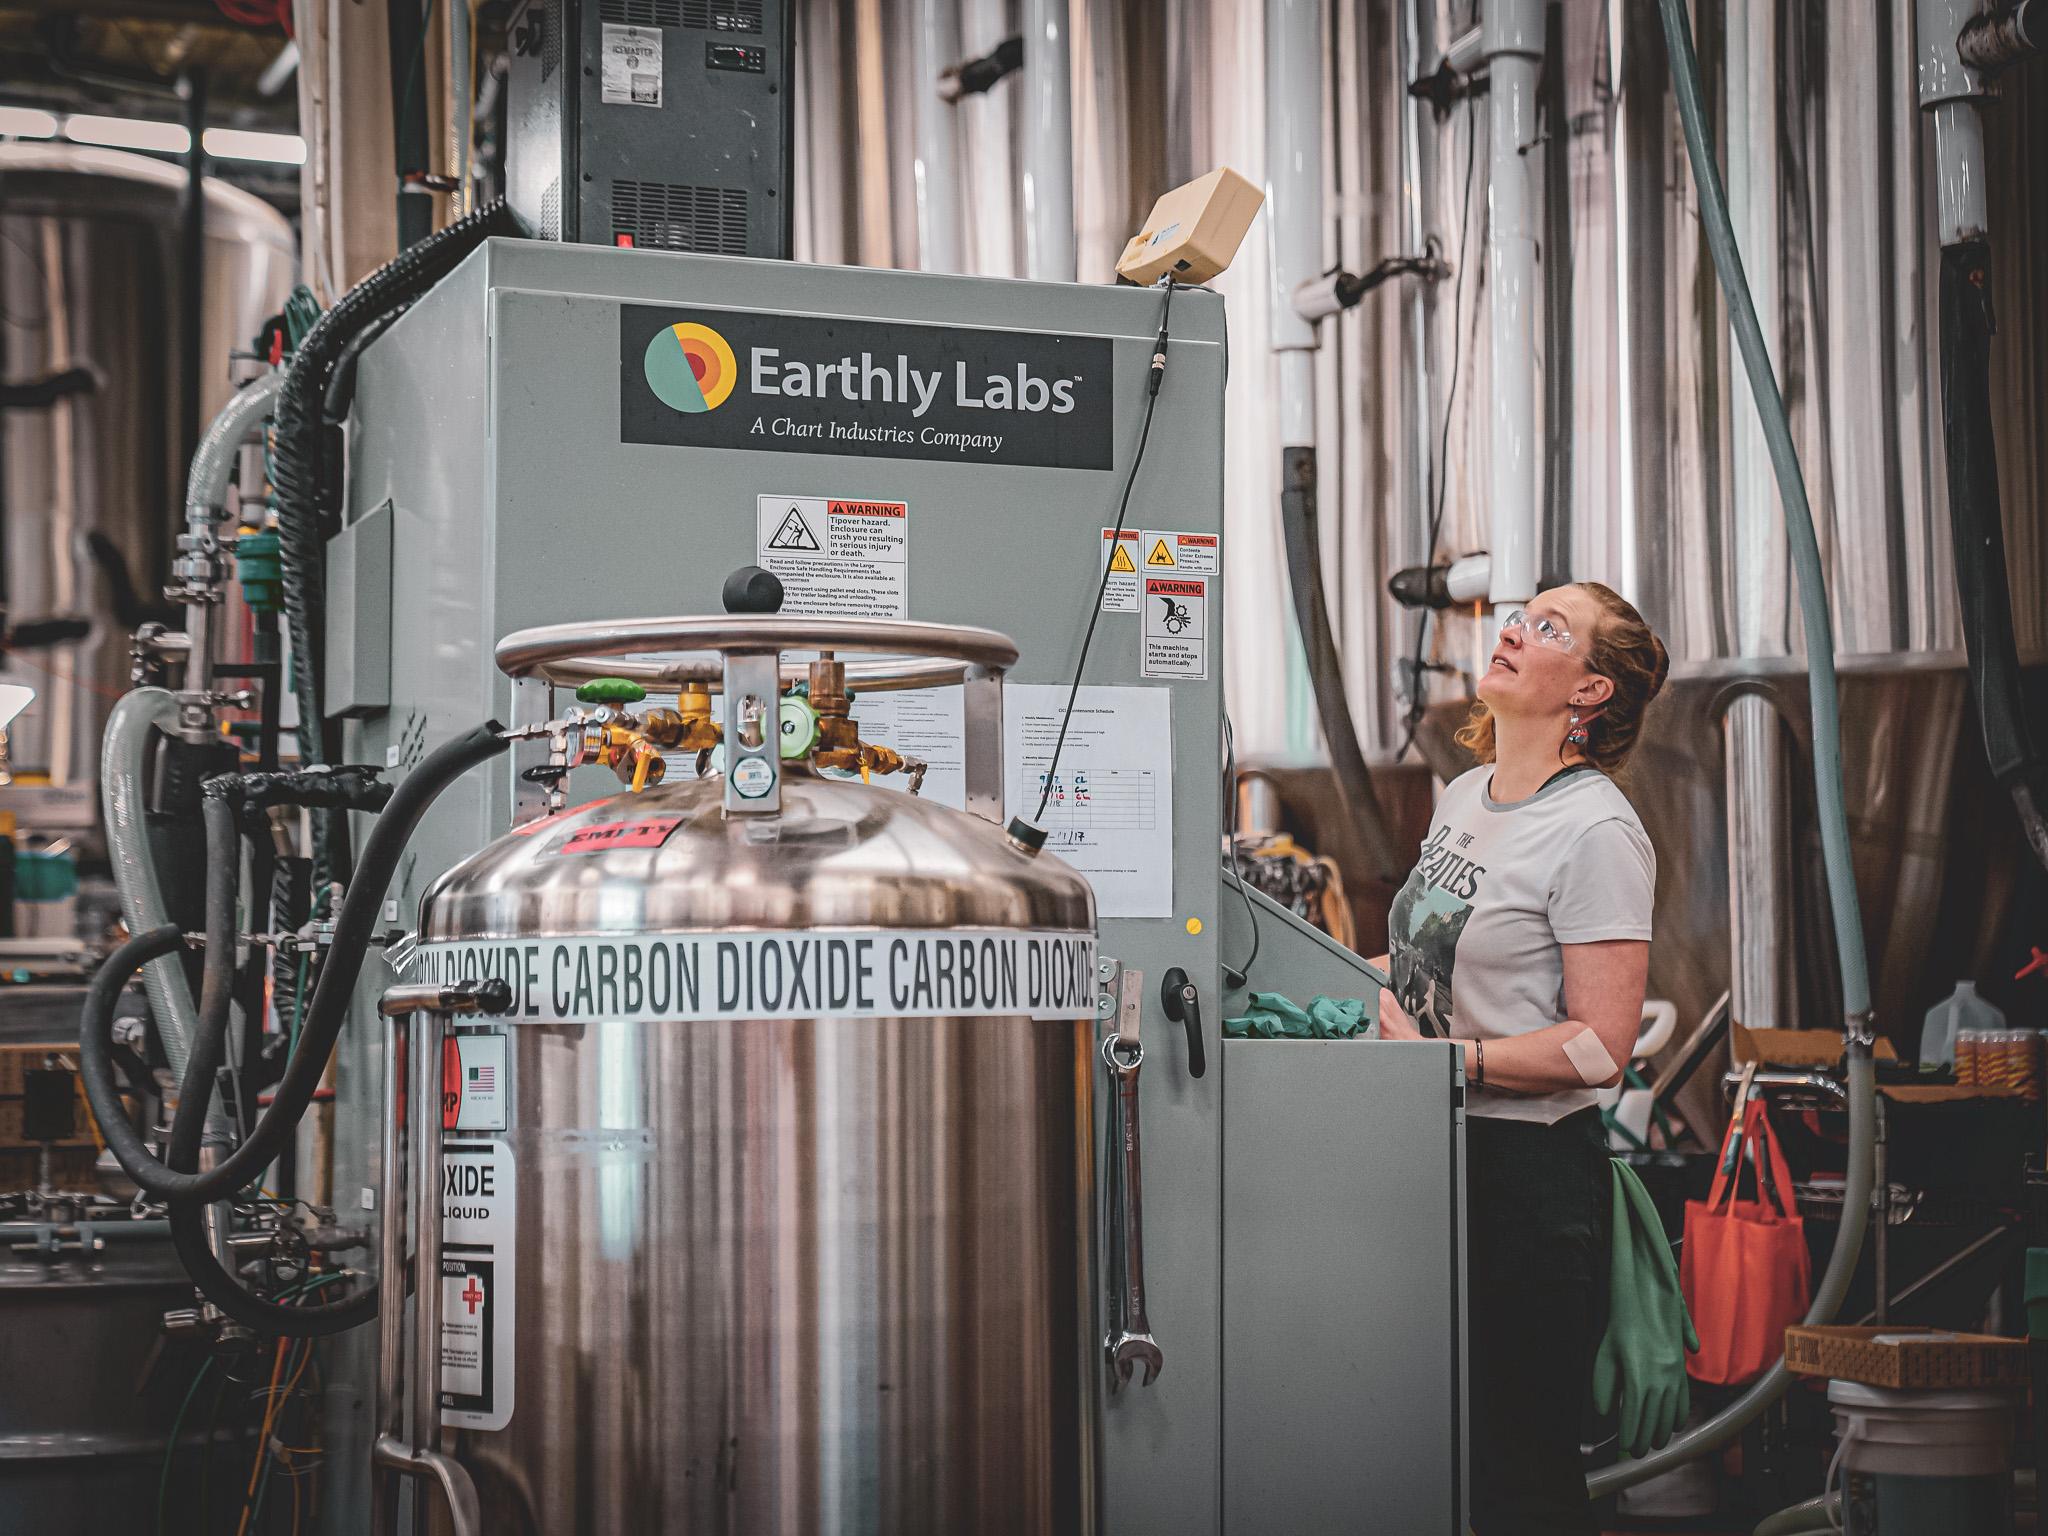
Developing resources to cope with climate-related issues is an immediate need for businesses to operate as usual in extreme conditions such as increasing wildfires like the North Complex fire blanketing San Francisco with smoke. Credit: Christopher Michel, CC BY 2.0
 data to map and analyze information about locations, such as this image from 2017 showing differences in urbanization and forestry resources between North and South Korea. Mitigation strategies can then be developed for climate-related weather changes and disasters. Credit: Esri")
Esri’s ArcGIS system compiles, analyzes, and displays geographic information system (GIS) data to map and analyze information about locations, such as this image from 2017 showing differences in urbanization and forestry resources between North and South Korea. Mitigation strategies can then be developed for climate-related weather changes and disasters. Credit: Esri Inc.

Extreme floods like this one in Hamburg, Iowa, where the Missouri River broke through two levees and flooded fields, are increasing under the influence of climate change. First Street Foundation created the Flood Factor program to ensure that anyone can see how climate change will alter the 30-year flood prediction for any property in the nation. Credit: NASA

Wildfires are larger, hotter, and spreading into areas that were previously thought to be at low risk. Delos Solutions created a new risk assessment program that incorporates climate change factors and hundreds of data points, some provided by NASA, to assess the current and long-term likelihood of fire for property owners in California. Credit: U.S. Fire Service

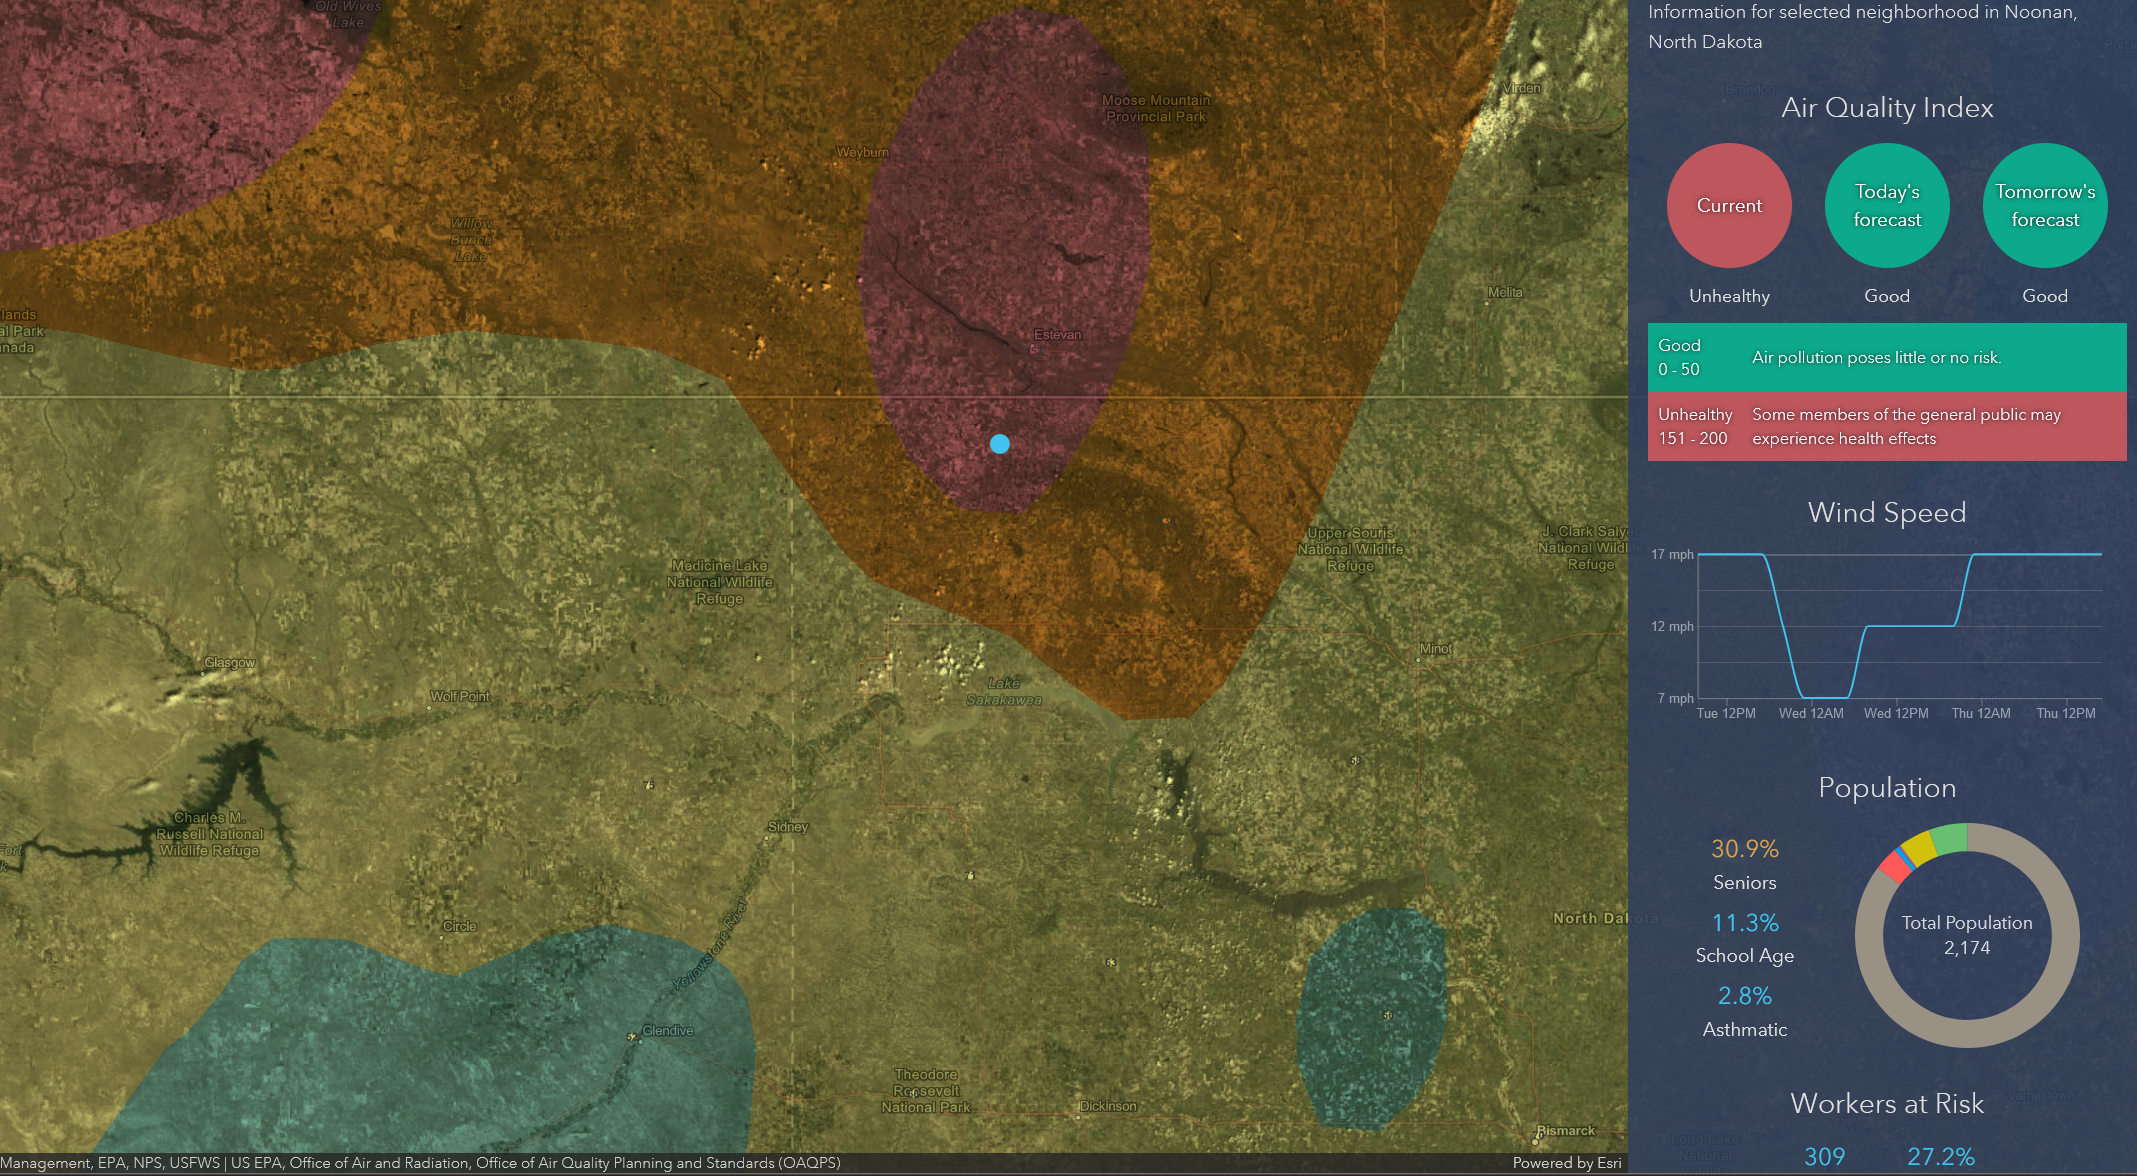
Building on NASA Earth-observation satellite data, the Pacific Disaster Center’s DisasterAWARE platform automatically generates reports like this one about flood risk in Illinois. With a subscription to Tenefit Corporation’s DisasterAWARE Enterprise version, a company now has more than just a weather forecast to assess the level of risk for employees, local facilities, and infrastructure, informing decisions about evacuation and steps to mitigate disruption to business activities. Credit: Pacific Disaster Center
Climate-resilience planning relies on science-based projections to envision future environmental conditions. The new normal will include more frequent and more severe events such as floods or wildfires like this one in Dargo, Victoria, Australia. Credit: fir000c/Flagstaffotos, CC BY-NC