
Satellite Data Inform Forecasts of Crop Growth
NASA Technology
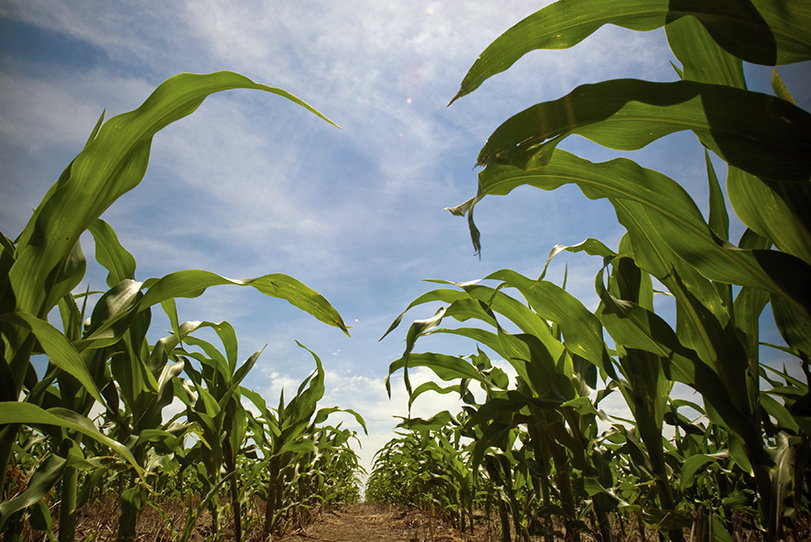
Farming has never been more productive, but increasing demands from a growing economy and world population mean age-old risks such as insects and plant disease remain significant challenges for agriculture. To advance technologies that would make farming more efficient and productive, NASA teamed up with the United States Department of Agriculture in 2000 to form the Ag 20/20 program. An important intention of the Ag 20/20 program was to champion the use of remote sensing technology for operational use in agricultural crop management practices at the level of individual farms. Managed on NASA’s end by scientists at Stennis Space Center, Ag 20/20 supported the incorporation of NASA geospatial data into the development of innovative crop management technology tools that could lead to increased production efficiency, decreased economic risks, and decreased environmental impacts from farming operations.
Among those supporting the program was the Institute for Technology Development, a nonprofit corporation based in Mississippi. One of its researchers, Ken Copenhaver, worked with NASA beginning in the mid-2000s to analyze satellite data, especially data coming from Moderate Resolution Imaging Spectroradiometer (MODIS), an instrument flown on two NASA satellites, Terra and Aqua. MODIS provides a complete picture of Earth’s surface every one to two days in 36 spectral bands, giving us a wide-ranging view of what’s happening on the planet, from forest fires and atmospheric water vapor levels to phytoplankton blooms. Copenhaver worked with researchers at Stennis to match remote sensing imagery from MODIS into applied models that could yield information on crop health and vigor throughout the growing season.
Technology Transfer
Several years later, the funds for the institute’s contracts dried up, and Copenhaver joined the University of Illinois at Chicago (UIC), where a colleague of his named Steffen Mueller was working on similar land-use and agriculture projects. Because the local area is a big corn-producing region, Copenhaver and Mueller soon teamed up to develop models that could predict crop production. “It started with interest from ethanol plants, because they have to go out and buy directly from corn producers, and they want to know what corn production is like in the counties that surround them. Grain elevators were facing the same problem,” says Copenhaver.
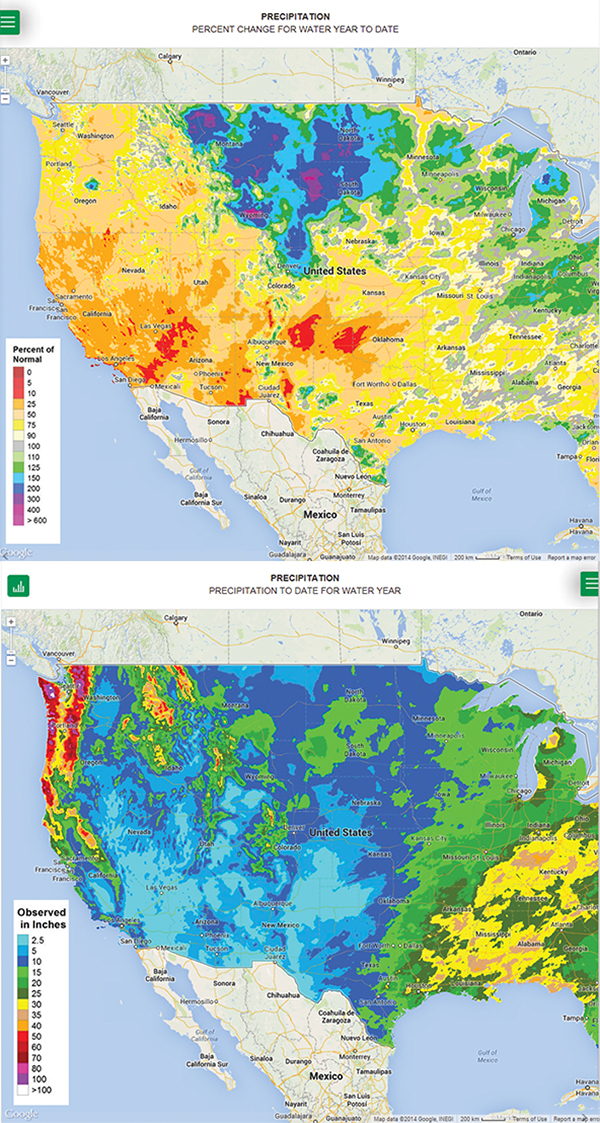
He used what he learned during the Ag 20/20 Project to incorporate geospatial information into his model, particularly data coming from MODIS’s daily surface reflectance measurements—that is, measurements of how much solar radiation different parts of Earth’s surface reflect, which reveals a great deal of information about ground cover and how it changes over time. With a 250- meter resolution, the information allowed Copenhaver to start predicting yield on a local scale, and the resulting software tool became known as LandViewer.
Not long after Copenhaver joined UIC, Mueller was at a conference and met Susan Olson, vice president of products for agriculture and biofuels at Genscape Inc., which has its corporate headquarters in Louisville, Kentucky. Genscape specializes in providing real-time data that informs decision-makers in energy markets, and the two got to talking about LandViewer and its applications in Genscape’s area of interest. “One thing led to another,” says Copenhaver, “and Genscape ended up buying LandViewer from UIC in 2013 and then hired us to develop it.”
Benefits
Now commercially available as subscription-based software, LandViewer uses a variety of data to provide daily updates on the state of corn vegetation, incorporating nearly 30 variables that include NASA satellite data. The result is a prediction of future corn production on national, state, and county scales—a level of detail that is rare among competing products, says Copenhaver.
“That’s because of the way we incorporate NASA’s geospatial data into the model,” he says. “If we didn’t have the NASA data, we’d just be offering what everyone else offers: a weather model that predicts yield. But the NASA data allows us to work at a high resolution, and it gives us the ability to adjust our model if crop production isn’t matching what the weather models say it’s supposed to be.”
The NASA data LandViewer uses comes primarily from MODIS. Vegetation vigor measurements are well known as an accurate predictor of eventual crop yield, and Genscape uses MODIS’s daily surface reflectance measurements to develop vegetation vigor maps. These are supplemented and validated by nighttime surface temperature measurements provided by MODIS and then compared to previous years’ models and yields to create forecasts.
These data don’t just provide high-resolution geospatial information; Copenhaver says they can also give the company additional insights that weather-based prediction models miss. For example, when a corn plant overheats, its respiration and photosynthesis are both impaired, and that negatively affects yield in the long run. “Overheated crops tend to shut down at night, and we can actually see that by analyzing nighttime surface temperatures on a field-by-field basis,” he says. “Observations like that are factors in our model.”
LandViewer’s primary user base is still ethanol production plants, which, it turns out, really means the corn farmers themselves. “You might think that we’re giving ethanol plants the advantage in bargaining with farmers, but the fact is that the farmers are the ones sitting on the boards of these plants, for the most part,” says Copenhaver. “What we’re finding is that this software gives everyone better information so that everybody can make the best decisions to help keep the wheels of this industry turning.”
The software is still a relatively new product, and the company is exploring its potential in multiple markets. In addition to ethanol plants, the company is also promoting the software to grain traders who buy and sell corn on a large scale daily. For traders, advance knowledge of probable corn production levels can help them set better prices and manage risk.
Genscape’s NASA connection is an ongoing one, as the company grabs the latest satellite data every day to inform its prediction models. But Copenhaver says the real core of the technology is a product of his time at Stennis. “The model powering LandViewer came directly from those days: I worked with different groups that were using MODIS data, calibrating it, and developing new products for MODIS. It was while I was at NASA that I learned a lot about how to do this.”
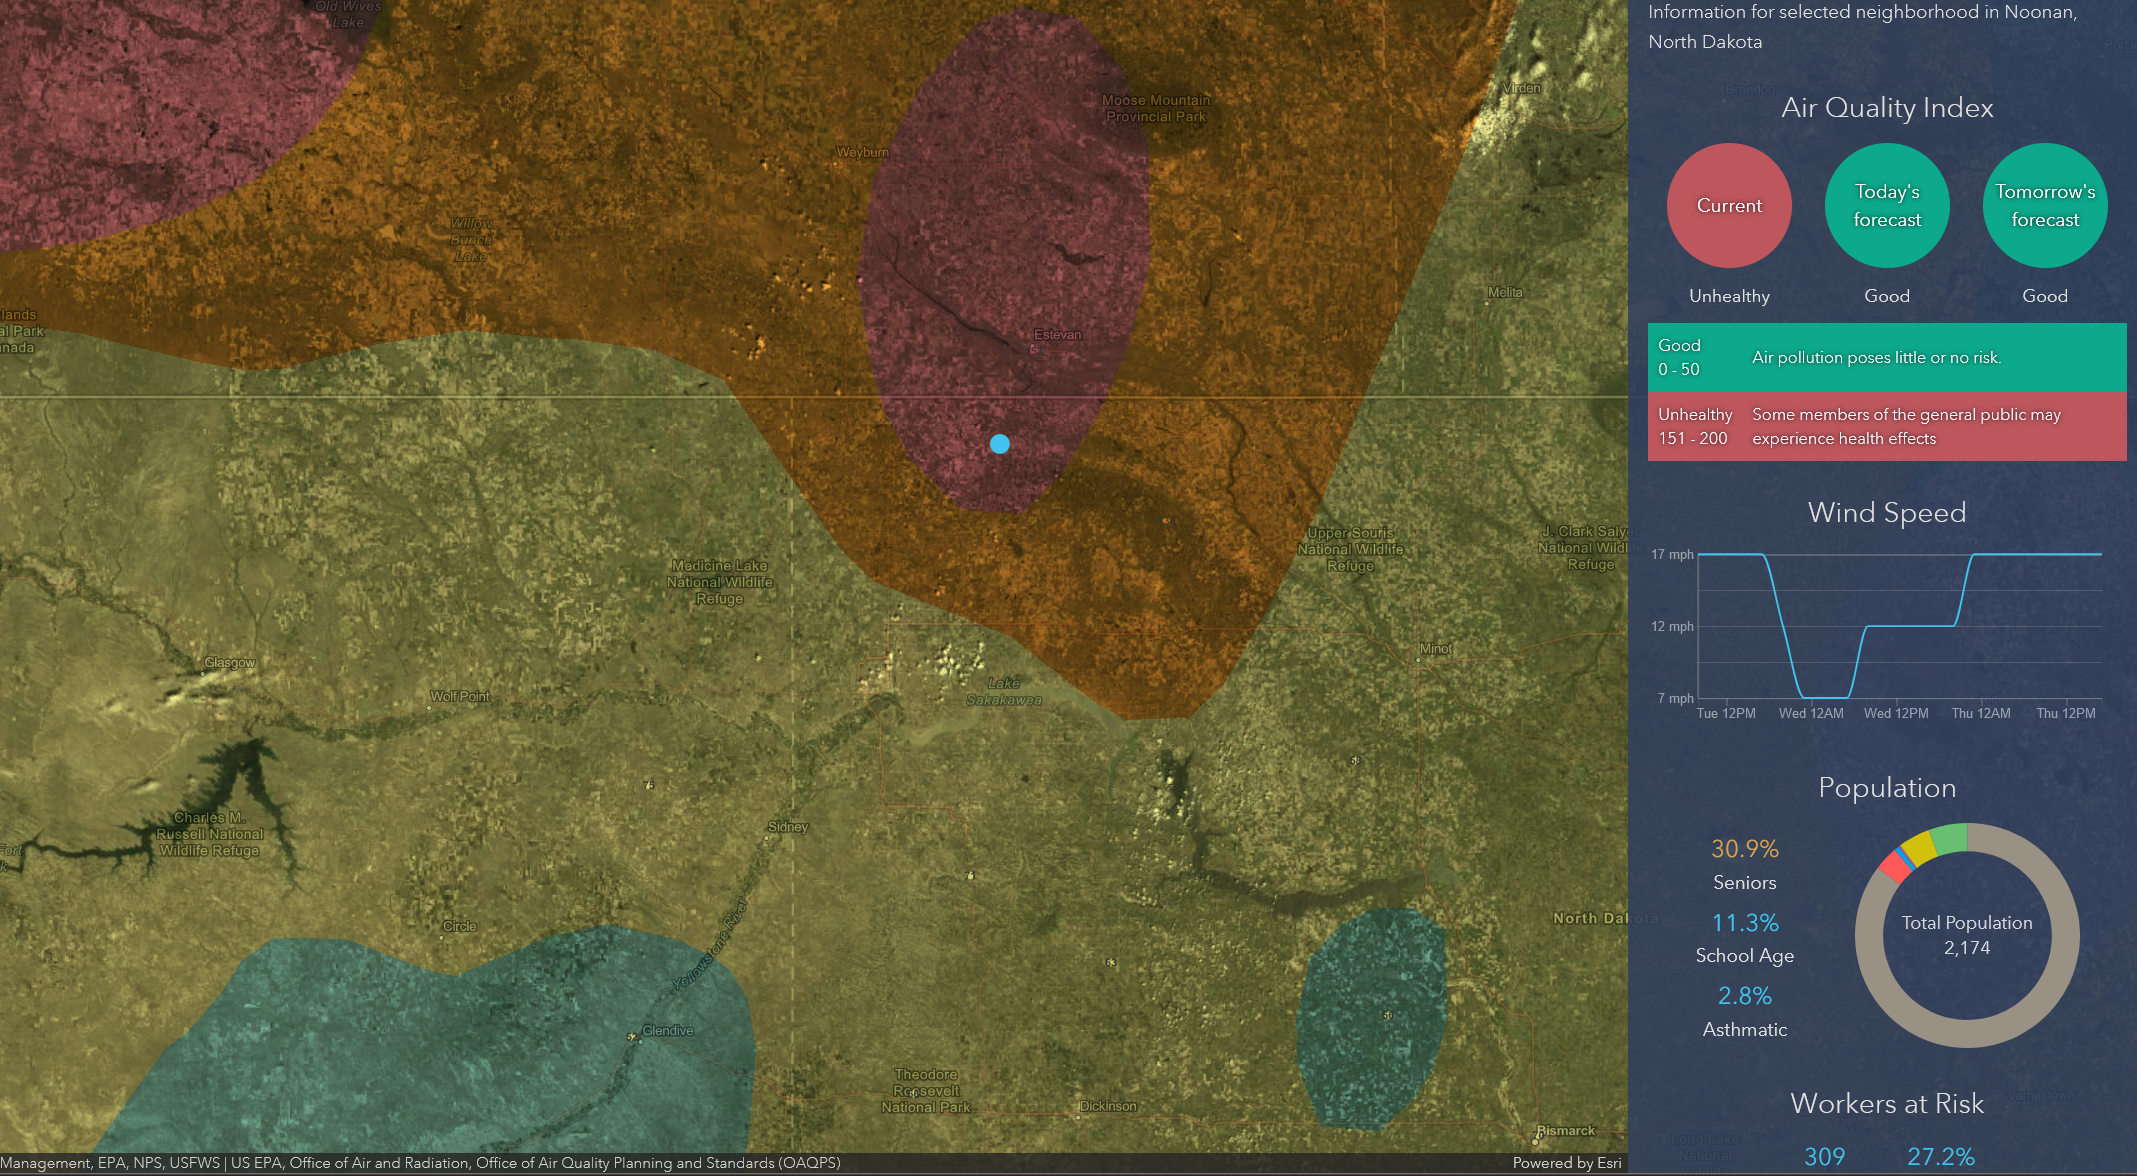
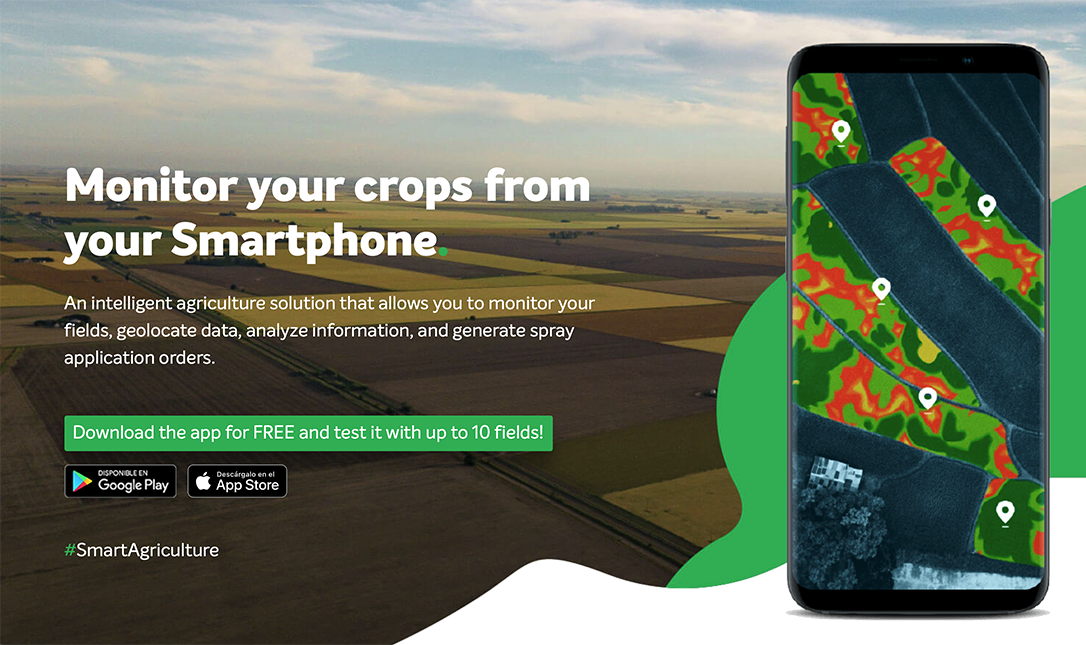
LandViewer is an online, subscription-based product that predicts crop production. The software dashboard provides real-time views of the latest data and includes tools such as comparison map views and data commentary.