

The View from Space Keeps Getting Better
Subheadline
After 50 years of Landsat, discovery of new commercial and scientific uses is only accelerating
The 30-acre pear orchard in the Sacramento-San Joaquin River Delta has been in Brett Baker’s family since the end of the California Gold Rush. After six generations, though, the most precious resource in California is no longer gold – it’s water. And most of the state’s freshwater can be found in the delta.
Because so much of California now depends on that water, around 2010, the state mandated that all landowners in the delta monitor and report the water they use on their land. What sounded like a simple requirement, however, was not. Equipment to measure water diversion is expensive, and the estuary’s twice-daily rise and fall with the tides makes measurements inaccurate, said Baker, adding that the data also is only reported for the previous year, further limiting its usefulness. Meanwhile, the state has calculated water consumption in the area using an outdated equation that doesn’t reliably account for local weather, groundwater flows, or runoff into the delta. “The utility of that data is minimal, if any,” Baker said.
In the last few years, though, accurate, near-real-time measurement of actual water use in the delta has become possible, not with meters on the ground but with satellite instruments in space. The OpenET platform, created by a consortium including NASA, the U.S. Geological Survey (USGS), and several other partners, can calculate the total amount of water transferred from the surface to the atmosphere through evapotranspiration. This is the combined moisture evaporating from soil and transpired, or “exhaled,” by plants. Evapotranspiration is a key measure of the water that’s actually being removed from a local water system. And it’s calculated based on imagery from Landsat and other satellites in low-Earth orbit.
OpenET is only one of the latest practical uses that researchers and businesses continue finding for Landsat imagery, 50 years after the program’s first satellite launched.
A New Standard in Imagery
On July 23, 1972, months before the last Apollo astronauts went to the Moon, NASA launched the Earth Resources Technology Satellite, later renamed Landsat 1, from Vandenberg Air Force Base in California. The world’s first space-based land observatory carried two imaging sensors – a television-style camera, initially considered the primary imager, and an experimental multispectral scanner (MSS).
The MSS was conceived by Virginia Norwood, one of the first female engineers at Hughes Aircraft Company. Many involved in the project were initially skeptical of the imager, but its detectors were digital, making its imagery open to precise calibration and computer analysis, and it collected light in specific visible and infrared wavelengths selected for their ability to reveal characteristics like plant health and soil moisture.
After seeing the first images from orbit, the Landsat team designated the MSS the primary imager, and subsequent Landsat imagers, through Landsat 9, launched in 2021, have all been advances to the basic MSS concept. Norwood became known as “the Mother of Landsat.”
The original satellite exceeded expectations, successfully improving crop-yield predictions, spotting deforestation, monitoring lake and river levels, discovering uncharted islands, and much more. It paved the way for a multitude of other Earth-imaging satellites from NASA, other space agencies, and, later, private companies. Today, even the commercial satellites capturing high-resolution Earth imagery typically rely on Landsat for the precise calibration that makes their data useful for science.
But in a way, the whole concept was far ahead of its time. In the 1970s, before digital displays were common, scientists might print the data in the form of characters on a line printer, contour the characters with a marker, and then stand on ladders to view large-scale Landsat images, recalled Jeff Masek, who recently retired as Landsat project scientist at Goddard Space Flight Center in Greenbelt, Maryland, where NASA’s portion of the program is managed. Distribution meant mailing CDs or tapes. With the advent of high-speed internet and high-performance computing, access to – and applications of – Landsat data exploded in the 2010s. More recently, Masek said, cloud computing has enabled products built using the entire Landsat archive, a dataset most users simply couldn’t have downloaded.
Landsat Maps a Path for Companies
Maps became one of the most widespread uses for Landsat data, especially after 2008, when the Department of the Interior made all the imagery available free of charge. (Landsat is a joint mission between NASA and the USGS, which owns and distributes the data.)
While driver navigation software usually does not use satellite imagery, applications for hikers, runners, and bikers, for example, rely on it heavily. “For apps like Strava and AllTrails, satellite imagery is a significant enhancement for their users,” said Alistair Miller, who heads imagery products and partnerships for Mapbox Inc., naming two of the company’s prominent customers. Mapbox, based in Washington, D.C., provides a platform and map data that enable developers to create customized map-based applications. “Our main purpose is using imagery to enhance the context of the maps our customers create with our platform,” Miller said.
As a small startup in 2010, he said, the company couldn’t spend millions on proprietary images and instead integrated data from Landsat. The global coverage and regular updates – capturing images of the same areas every 14 days – enabled the company to build huge, cloud-free images of Earth.
The company eventually started purchasing commercial, high-resolution images, and today Mapbox blends these with data from one of Landsat’s direct descendants, NASA’s Moderate Resolution Imaging Spectroradiometer (MODIS) to let users seamlessly zoom in and out of views.
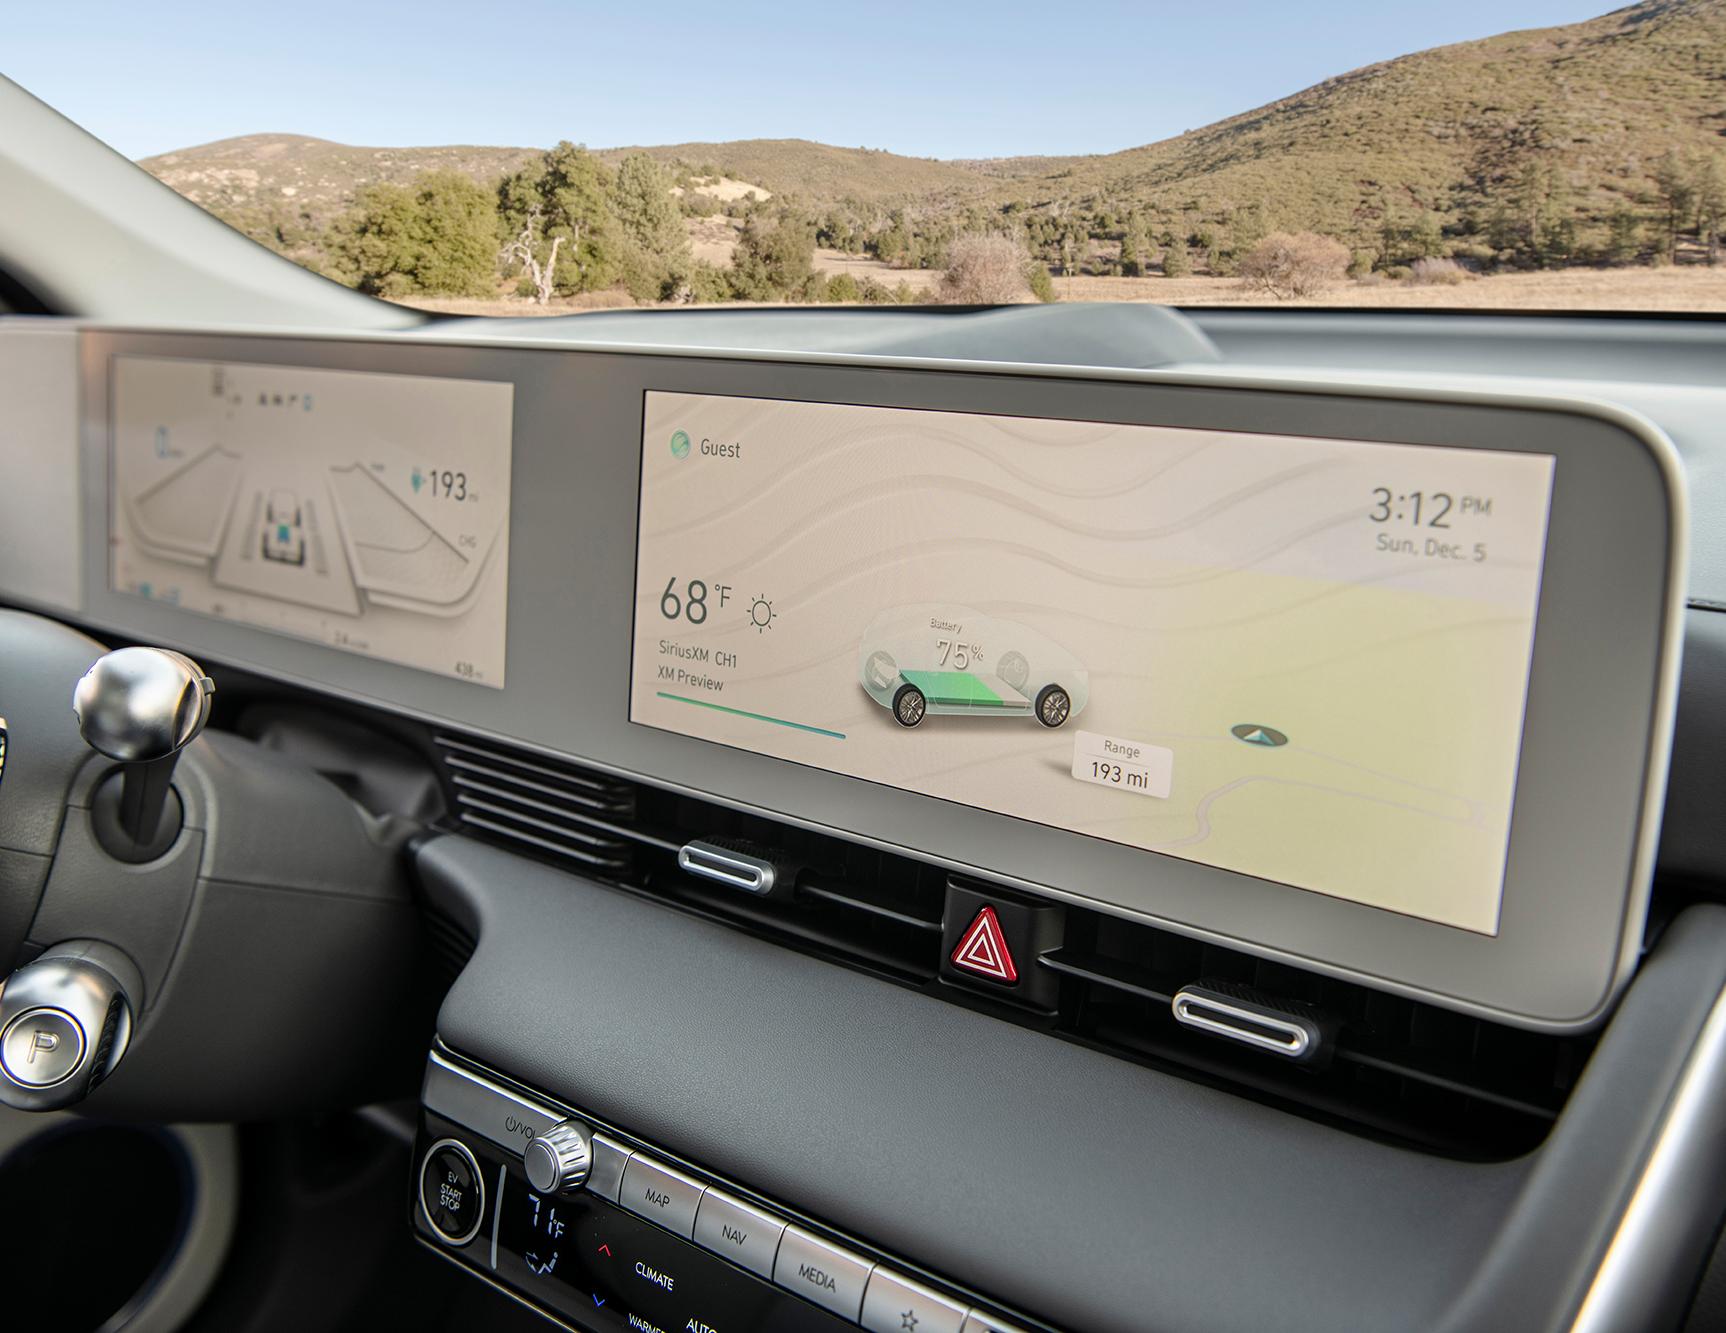
Mapbox now has hundreds of employees and is valued at more than $1 billion. Among its customers the company counts the Weather Channel, Tableau, ocean cruise companies, and travel planners; automakers like General Motors, Toyota, and BMW; media outlets like CNN, the New York Times, and National Geographic; and many others.
“We have an appreciation for NASA essentially starting the Earth-observation industry,” Miller said. “If it weren’t for Landsat, we wouldn’t be where we are in terms of understanding our Earth.”
New Image Analysis Supports New
Farming Techniques
Some of the most pressing questions people ask about Earth are about the food it’s producing. Agriculture and adjacent industries like farm equipment manufacturers and grain futures traders are among the heaviest users of Earth-imaging satellite data, which can help assess crop health and predict yields.
Even in this well-established niche, though, new capabilities continue to emerge. One up-and-coming company, Boulder, Colorado-based Perennial Inc. – formerly Cloud Agronomics – was founded in 2018 to validate sustainable farming practices by measuring carbon stored in the earth. To do this, the company relies on Landsat, as well as the European Space Agency’s Sentinel satellites.
Perennial is working to enable the emerging markets for carbon credits, through which farmers can get paid for using practices that maximize their land’s storage of carbon, explained cofounder and Chief Technology Officer David Schurman. These might include reducing soil tillage, planting cover crops during the off season, reducing fertilizer usage, and changing grazing practices. Satellite images can determine not only whether a farm is using these techniques but also the carbon content of the ground. “The amount of carbon in soil is highly correlated to the spectral reflectance of that soil at specific wavelengths,” Schurman explained.
Perennial Chief Scientist Jim Kellner noted that direct testing can also determine soil’s carbon content, but “we’re clearly not going to go out into the world and dig holes in every farm,” he said. Satellite data, on the other hand, is available for all of Earth’s land cover and “allows you to solve the problem at a price people are willing to pay,” he said.
In the United States, carbon credit trading registries are managed by non-governmental organizations, but in Australia, the government manages credits. There, Perennial has found abundant business in the red-meat sector, which is trying to reach carbon neutrality by 2030, said Schurman.
He said the company is also discovering interest among food companies that want to reduce their environmental impact, letting them audit suppliers’ carbon footprints and make informed decisions about where to buy food and who to reward with incentives.
Other major Perennial clients are in the fertilizer, farm equipment, and agricultural lending businesses. In the last year, Schurman said, the company has tripled or quadrupled the amount of land it’s analyzing for customers, covering hundreds of thousands of acres.
In addition to reducing greenhouse gases, said Kellner, “we want to make lives better for people involved in agriculture. We want to put money in the pocket of the farmer. And we want to reduce chemical inputs and have public health benefits by reducing exposure to things like pesticides.”
Landsat provided the scientific-grade images that enabled all this, but Perennial had to figure out how to use that data to determine soil carbon content. While it’s not unusual for a company to put in this kind of work, NASA and the USGS also continually work to create tools and practical applications for Landsat. OpenET, the tool calculating water use at Baker’s pear farm, for example, is the product of years of work by scientists at multiple universities and agencies.
“Many of the scientists and software engineers on the OpenET team have been working on these models and approaches for more than a decade,” said Forrest Melton, NASA’s project scientist for OpenET. The platform uses Landsat data to essentially determine how much energy from the sun is reflected from Earth’s surface, versus how much is absorbed by the surface and the air. The more evapotranspiration that is taking place, the more energy is absorbed, and the cooler the land surface appears in Landsat’s thermal infrared imagery, Melton explained.
Baker, who, in addition to his family’s Sacramento County pear farm, represents other landowners as an attorney for the Central Delta Water Agency, said the data available from OpenET has finally allowed landowners and regulators in the Sacramento-San Joaquin Delta to reach a consensus and work together. “We’re in the most highly contentious place, maybe in the world, when it comes to water use,” Baker said. “It’s good public policy to start with a measure everyone can agree upon.”
What’s Next for Landsat?
Reprocessing and uploading the entire Landsat archive to the cloud was the biggest effort of the last several years at the USGS Earth Resources Observation and Science Center, but Chris Crawford, the USGS Landsat project scientist, said researchers there and at NASA are constantly working to extract more information from Landsat data. The recent development of the ability to calculate surface temperatures, for example, led to the ability to calculate snow and ice melt and measure urban “heat island” effects.
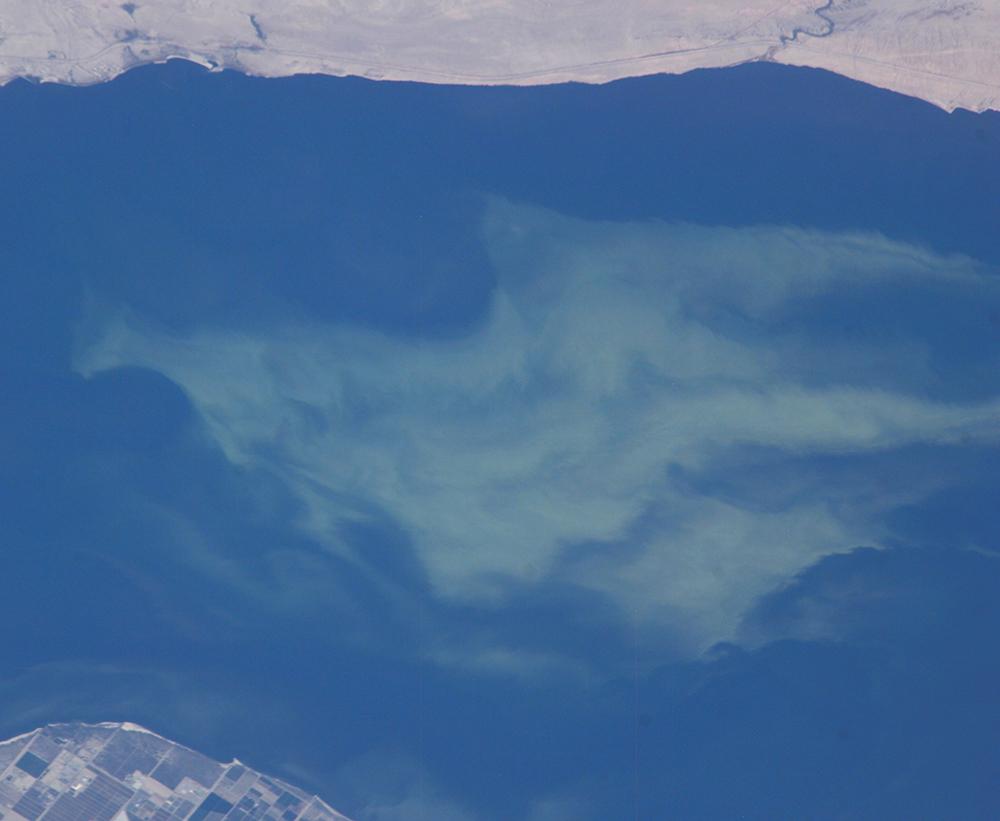
“There’s still so much more information to retrieve from Landsat’s 50-year, multispectral data record,” Crawford said. For instance, he said, the exceptional radiometric quality of Landsat 8 and 9 data might allow scientists to tease out current and historical information about water quality and floating algae blooms. Governments and businesses then find practical uses for each new stream of information. “The same data can be used over and over, so it just keeps adding value,” Crawford said.
With a data user community that keeps growing, scientists and engineers are already looking forward to the next mission. NASA and USGS are developing options for the next iteration of Landsat, currently called Landsat Next.
The USGS calculated that worldwide economic benefits of the Landsat program in 2017 alone totaled about $3.45 billion, with additional downloads from cloud vendors bringing that sum to $4.18 billion, a substantial return on the government’s investment. For example, the total cost for NASA to develop and launch Landsat 9 was about $700 million.
To the scientists and companies using Landsat data, the program is more personal than a dollar amount. “The analogy I always use is the family photo album,” said Masek. “We don’t realize how much Earth is changing until we look back through the photos. It’s almost a physical record of how Earth looked 50 years ago and how it’s changed.”
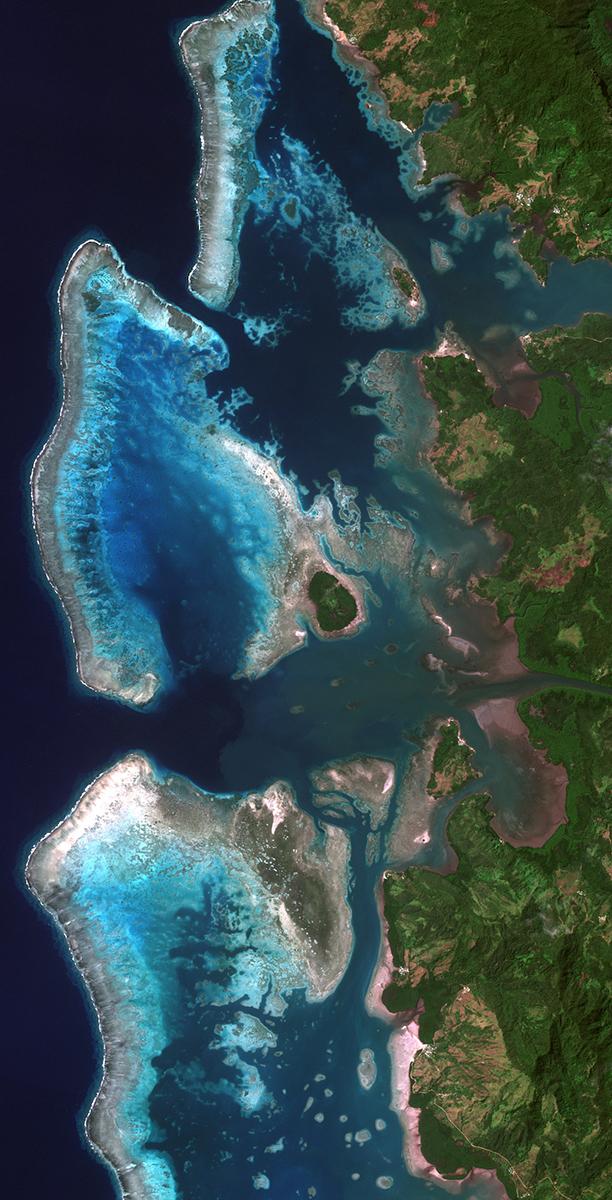
Farms in California’s Sacramento-San Joaquin River Delta face strict reporting requirements for water usage because the delta supplies most of the state’s freshwater. This Landsat image uses infrared wavelengths to depict vegetation. Credit: U.S. Geological Survey

The latest Landsat satellite, Landsat 9, went into orbit in fall of 2021. NASA and the USGS are already developing options for the next iteration of Landsat, currently known as Landsat Next. Credit: NASA

AllTrails, a popular app for finding hiking and biking trails, is one of many customers that build maps from the Mapbox platform. Although Mapbox no longer uses Landsat data, the company relied on Landsat to get its start and is considering reintroducing it to add features like vegetation cover and water depth. Credit: AllTrails LLC, Mapbox Inc.

This map depicting the ages of buildings in downtown Amsterdam was built with the Mapbox platform, which used Landsat data to get its start. Credit: Parallel Data Intelligence Ltd., Mapbox Inc.

This map shows the aggregated soil carbon level for each agricultural field around Marshaltown, Iowa, compared to the regional average, with reds indicating lower carbon content and greens showing more carbon. Perennial uses data from Landsat and other satellites to determine carbon levels. Credit: Perennial Inc.

Some of the datasets that go into Perennial’s models to determine soil carbon content include, from top down, visible wavelengths, infrared wavelengths, derived vegetation indices, temperature, and topography. Much of this information comes from the Landsat archive. Credit: Perennial Inc.

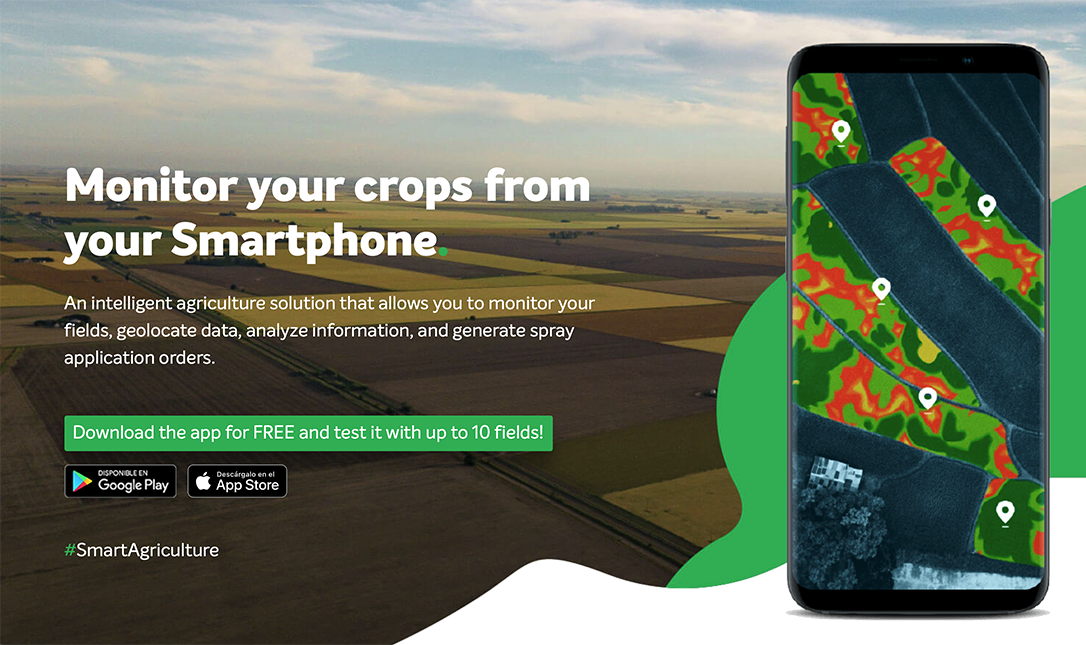
Perennial uses data from satellites like Landsat to help farmers monitor the carbon output and carbon sequestration of their operations, helping them access incentives like carbon credits and the business of environmentally conscious buyers. Credit: Perennial Inc.

Brett Baker checks a sprinkler on his family’s pear farm. Farms like his in California’s Sacramento-San Joaquin River Delta have to monitor their water use, but accurate estimates were nearly impossible until the advent of OpenET, a platform that uses Landsat data to determine the total amount of water evaporated and transpired from a given area. Credit: Environmental Defense Fund

A graph derived from the OpenET platform shows the annual fluctuation in evapotranspiration for a field between Fresno and Bakersfield in California. This information, calculated based on Landsat data, lets the landowner accurately report water usage. Credit: Environmental Defense Fund