
Mapping a Better Vintage
Environmental factors throughout a vineyard can significantly influence the overall quality of wine. Winegrowers have known for centuries that grapes harvested from different areas of a vineyard will produce wines with unique flavors. Affected by subtle differences in the physical characteristics of the vineyard such as microclimate, slope, water-holding capacity, and soil type, even a constant varietal and rootstock of grapes will produce wines with varying color, bouquet, body, and yield, depending upon their location.
Vineyards such as those located in California's Napa Valley tend to be subdivided into relatively large fields or "blocks" that often encompass heterogeneous physical conditions. Since growers typically treat the entire block as a single "minimum management unit" for cultivation and harvest, mapping and monitoring the variability within a block is a concern. Over the last decade, an increasing number of vineyard managers have utilized digital remote sensing and geographic information systems (GIS) to visualize the variability within their blocks. With computer software designed to overlay remotely sensed imagery with environmental and agronomic geographic data on a map, GIS helps growers recognize and explain patterns that might not have been obvious otherwise. GIS can also serve as a valuable archiving mechanism for future reference.
To further develop the use of image technology and GIS for vineyard management support, NASA's Earth Science Enterprise partnered with the U.S. wine and commercial remote sensing industries for a project known as the Viticultural Integration of NASA Technologies for Assessment of the Grapevine Environment (VINTAGE). With project investigators from NASA's Ames Research Center, the California State University at Monterey Bay, and the University of Montana, several prototype products have been developed to support agricultural decisions concerning canopy management and irrigation practice. One key VINTAGE aspect involved the evaluation of satellite and airborne multispectral imagery for delineation of sub-block management zones within a vineyard.
Researchers and vineyard managers analyzed imagery to divide individual vineyard blocks into zones of differing vigor. Using the normalized difference vegetation index (NDVI), a relative indicator of plant canopy density, blocks were subdivided for harvest based upon late-season vigor, resulting in more uniformly mature grapes, and improved quality of resulting wine lots in many cases. NDVI, which is determined by analyzing red and infrared bands from multispectral imagery, has values ranging from -1.0 to +1.0. Higher values indicate more active growth and productivity, while lower values indicate less active vegetation and nonvegetated surfaces. In the vineyard, these index values translate to higher and lower vigor, a factor that frequently relates to fruit characteristics, and ultimately, wine quality. The applied research has shown the feasibility of using such imagery, combined with selective harvest, to move wine lots from lower quality (and value) designations to highest quality reserve programs.
Based on VINTAGE's applied research, VESTRA Resources, Inc., recently released a commercial product known as the Vineyard Block Uniformity Map. Working as a VINTAGE project partner, VESTRA employed the ArcView™ 8.2 and ArcGIS™ Spatial Analyst software from Environmental Systems Research Institute, Inc., to find the percent coefficient of variation (a standard statistical measure) for each block within a 1,000-acre vineyard based on NDVI. The result was a vineyard-level map quantifying block variability, a helpful tool for crop managers.
VESTRA's new map product has already been delivered to several wineries. The maps can serve as an executive summary, allowings managers at companies with large and widespread vineyard holdings to easily identify blocks where new or revised management practices might need to be implemented. Providing a warning, the maps can indicate if a block shows variation over a certain percent. When the Vineyard Block Uniformity Maps are created in consecutive years, a change map can be developed to quantify the increase or decrease in uniformity. They are thus a measurement of success, since managers may use the change maps to determine the effectiveness of mitigation practices. The first Vineyard Block Uniformity Maps were produced for the 2002 growing season, and VESTRA anticipates adding change maps to its 2003 commercial product line. Other prototype products are under evaluation and may be available to growers in the future.
Located in Redding, California, VESTRA is a collaborator on the VINTAGE project along with the Robert Mondavi Winery and the nonprofit Bay Area Shared Information Consortium. All project partners have engaged in extensive industry outreach. VESTRA has worked closely with vineyards and wineries in prestigious U.S. wine regions such as California's Napa Valley and Sonoma County since 1995.
ArcView™ and ArcGIS™ are trademarks of Environmental Systems Research Institute, Inc.
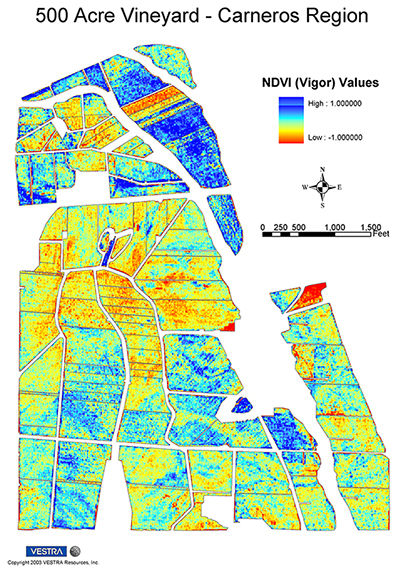
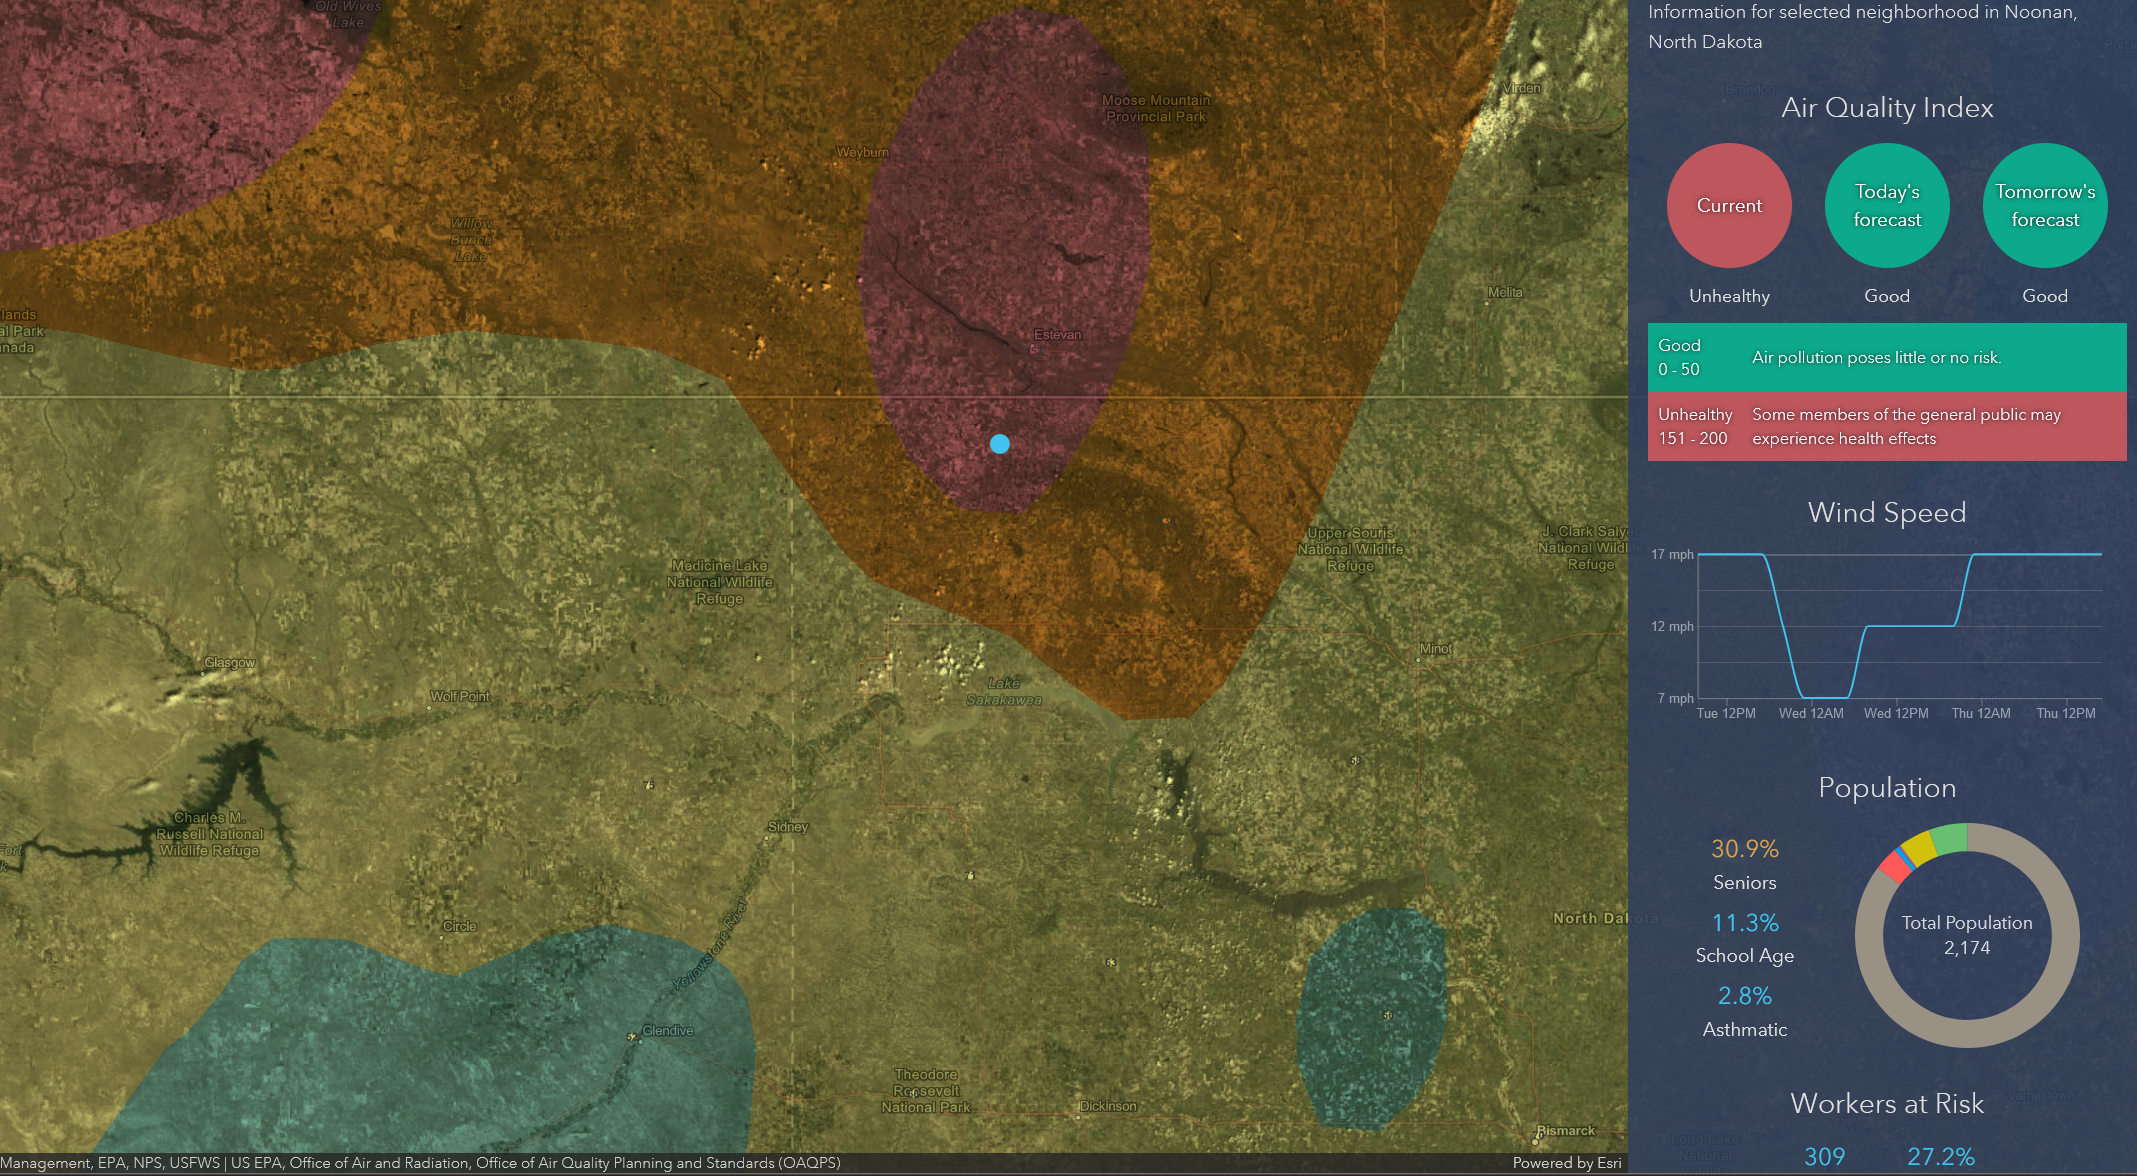
The normalized difference vegetation index (NDVI) is a relative indicator of plant vigor that can help vineyard managers to subdivide a grape harvest for more uniformly mature grapes. In many cases, this improves the quality of the resulting wine lots.
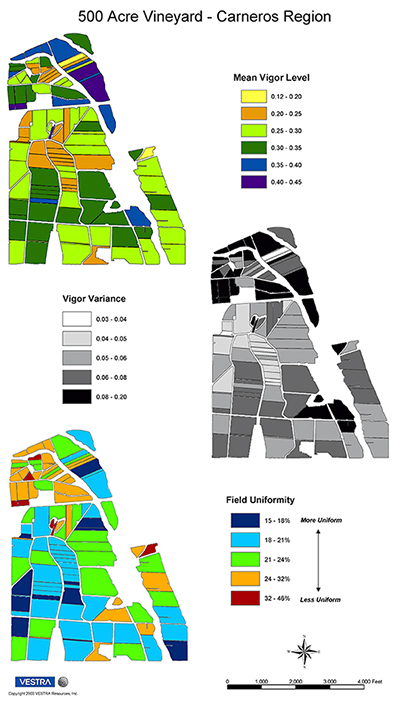
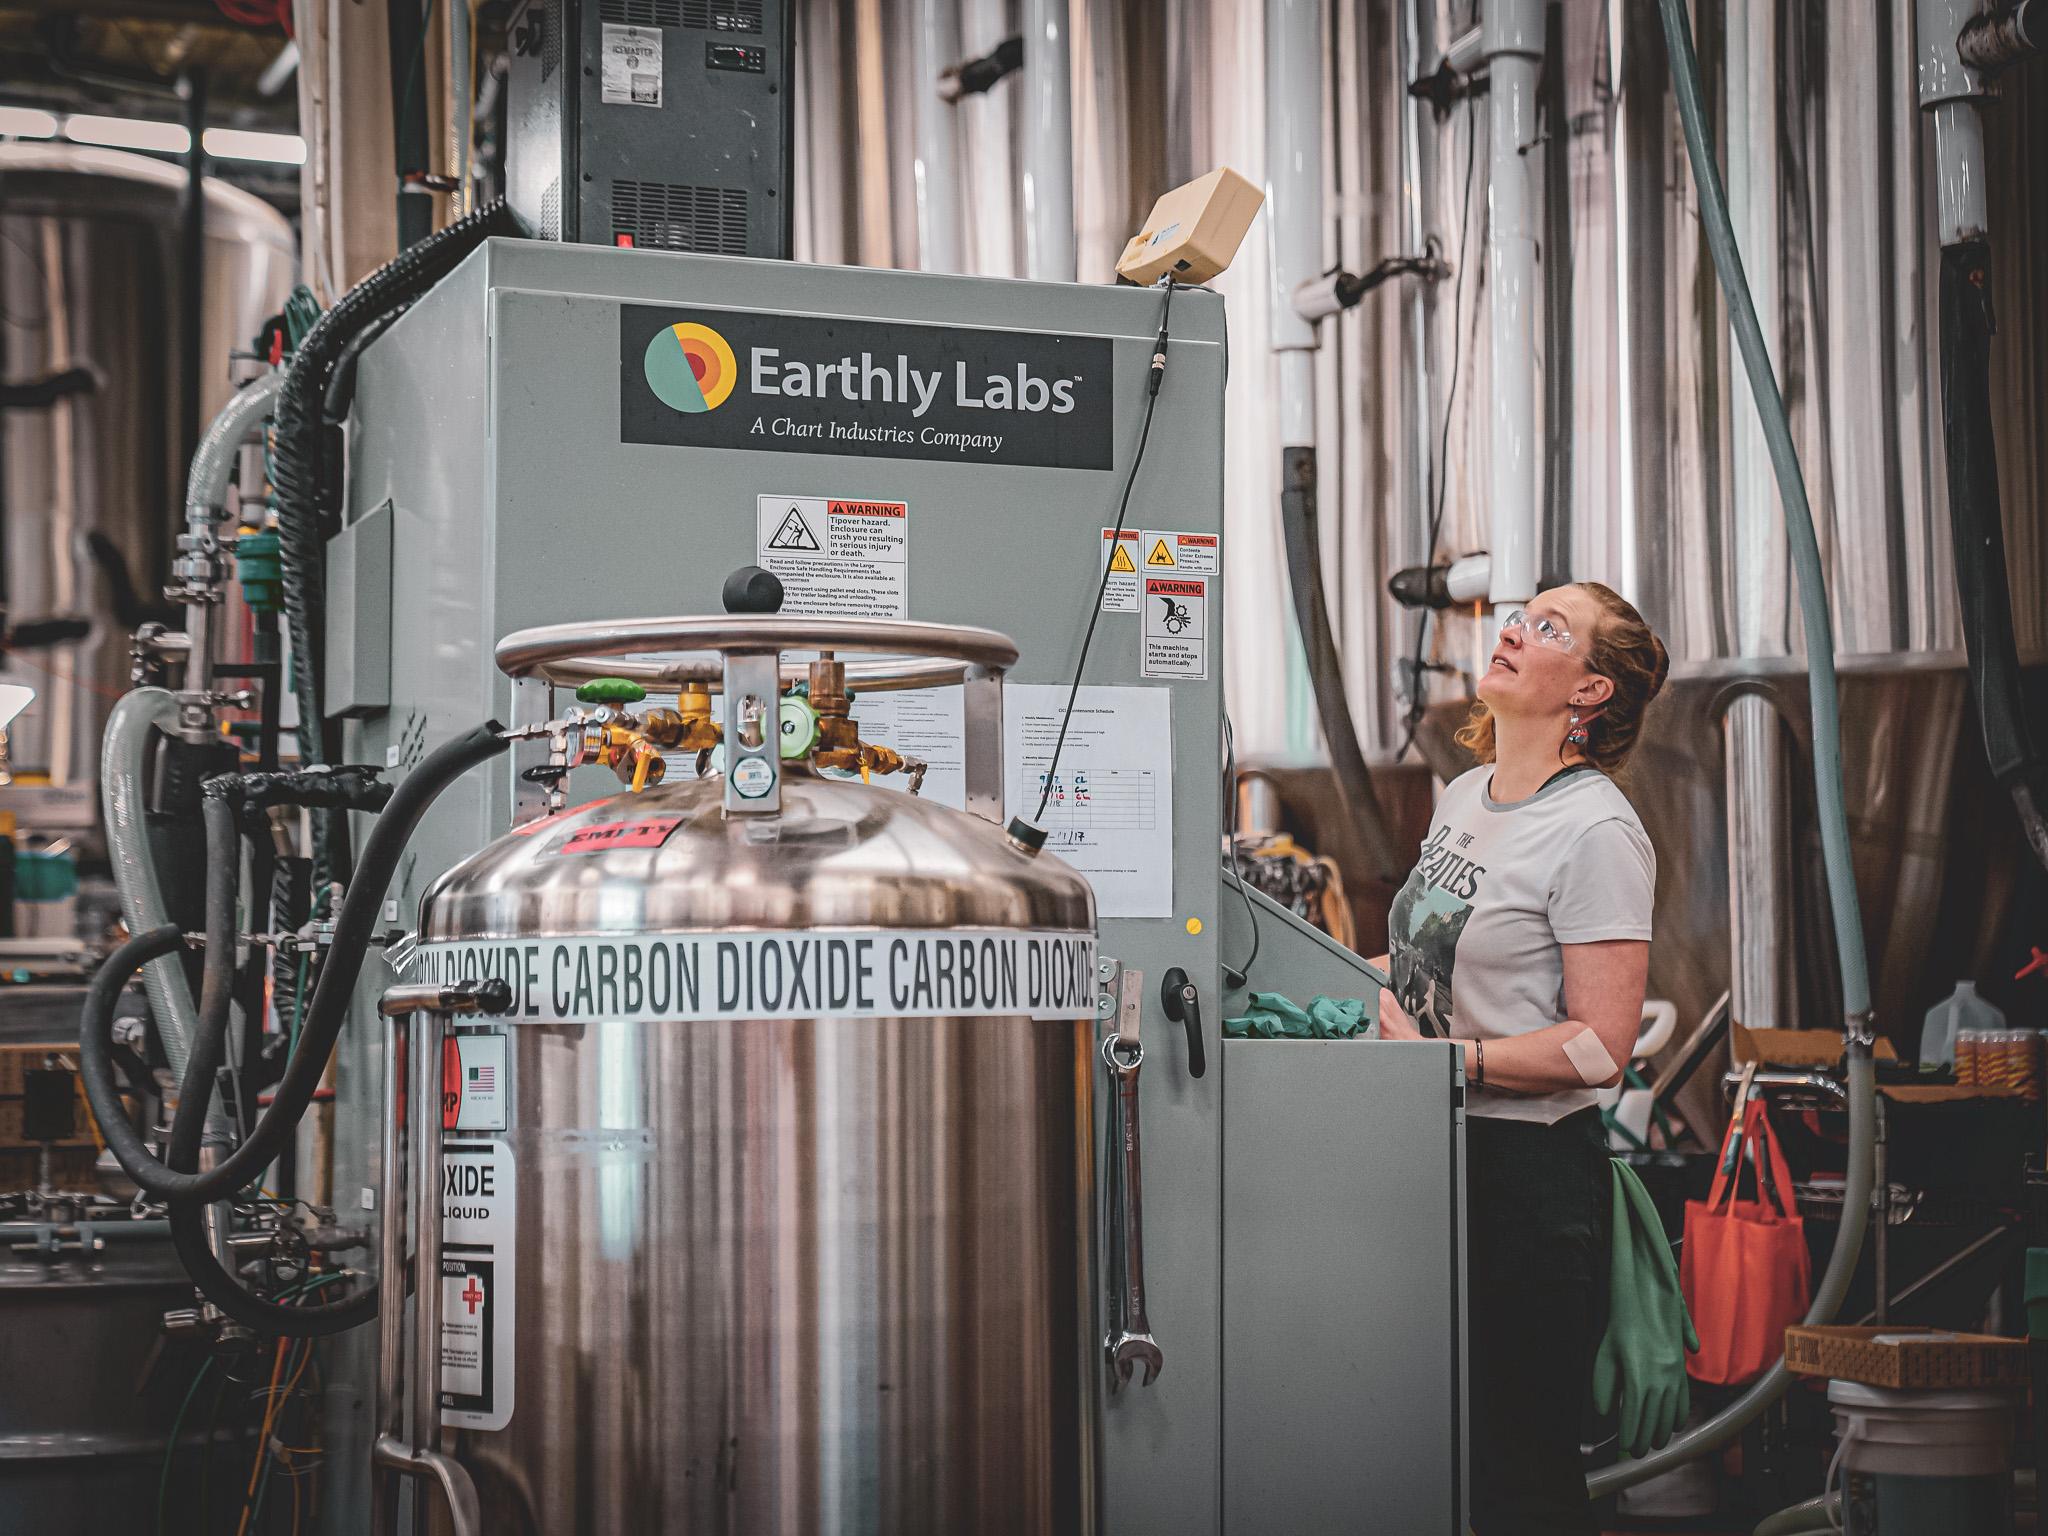
The Vineyard Block Uniformity Map helps winegrowers solve the problem of monitoring variability within a vineyard block.