
Mapping a World of Data
Subheadline
Easy access to NASA data helps businesses and individuals
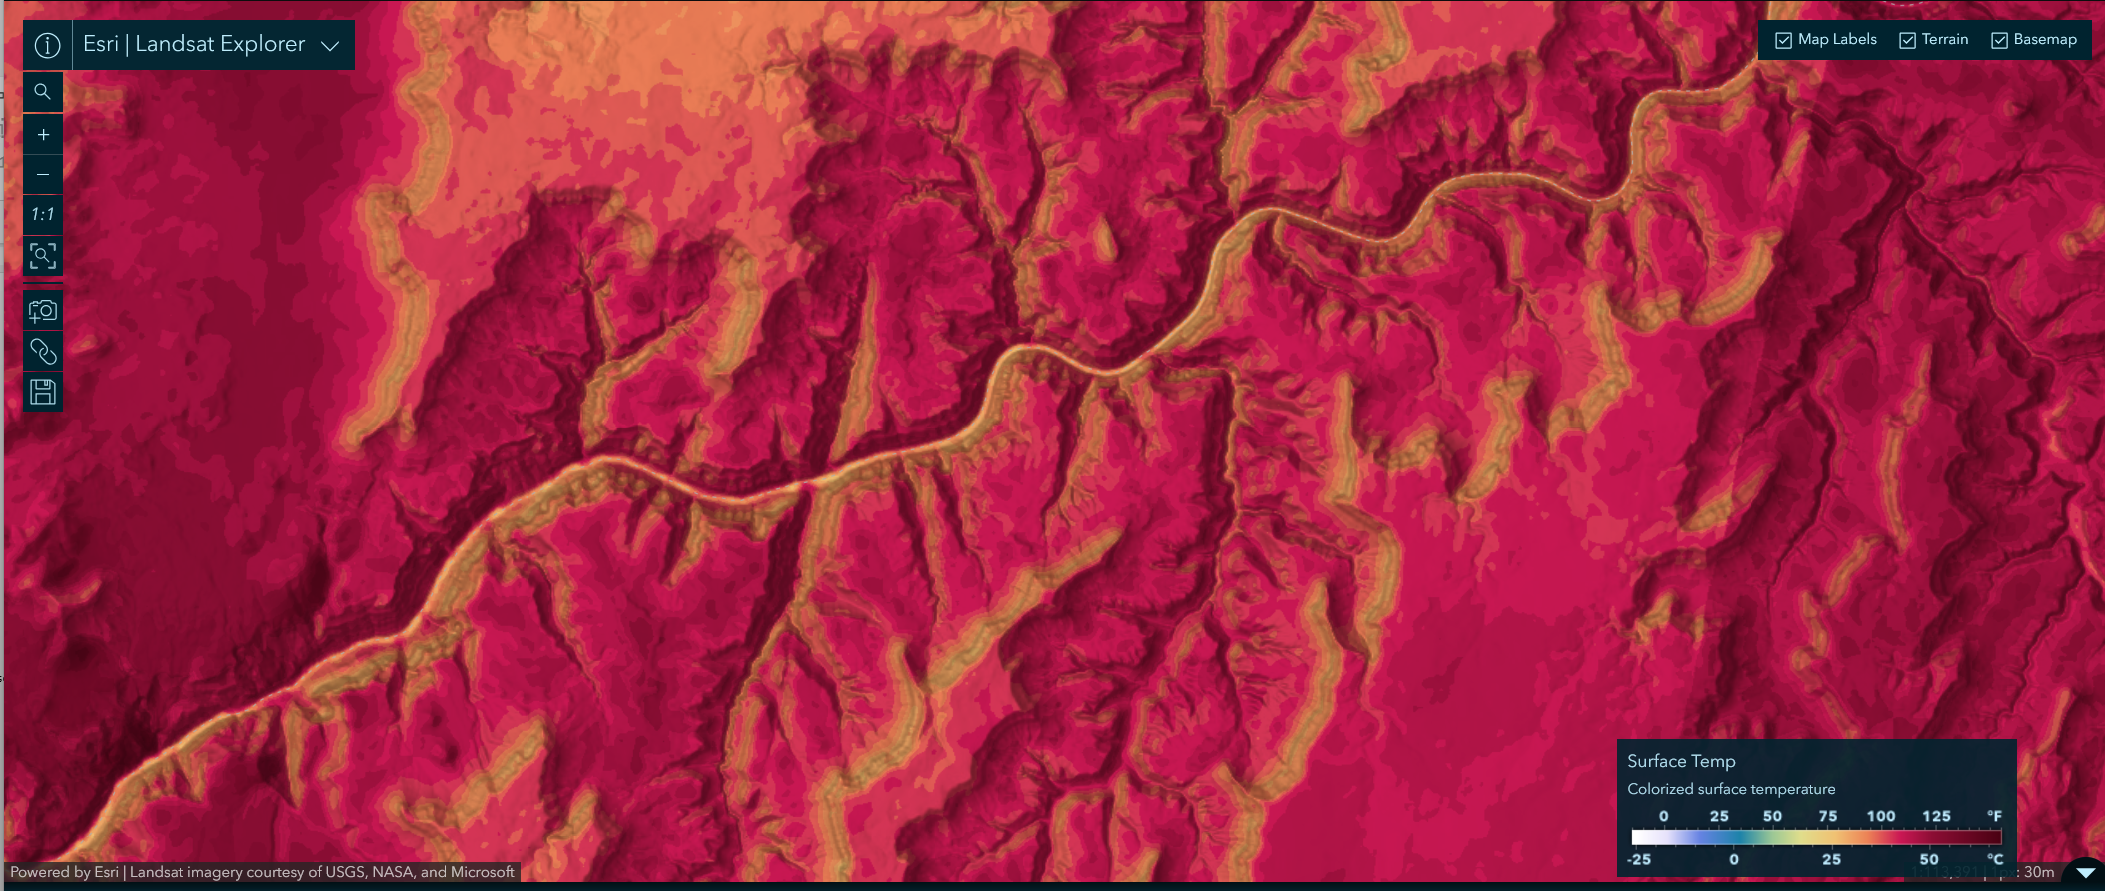
Choosing a hiking trail through the Grand Canyon is easier with a map that shows current ground temperatures and where vegetation will provide shade along the route. Urban planning decisions can also be reviewed and modeled with maps to show the potential impacts of new roads and parks on mitigating flooding and reducing urban heat islands over time. These maps and others can be created using the ArcGIS Living Atlas of the World website or apps.
Technology known as a geographic information system (GIS) that helps identify, organize, and analyze useful data serves as the foundation for numerous Living Atlas apps. Geospatial data about a location can be used to create maps providing popular data about air quality, wildfires, drought conditions, and more. Data compiled from thousands of sources, including NASA, makes it possible to view a wealth of information about any location around the world.
These free apps can be accessed using a smartphone, tablet, or computer. The data they rely on is constantly updated thanks to the efforts of the GIS user community and Esri, formerly known as Environmental Systems Research Institute Inc., of Redlands, California. The company developed and owns the ArcGIS platform and built the cloud computing infrastructure that allows any data provider to add their dataset in any format.
Living Atlas relies heavily on images and sensor data from Landsat satellites managed for NASA by Goddard Space Flight Center in Greenbelt, Maryland. Other datasets prepared by NASA contribute to apps that provide information about atmospheric conditions, such as weather forecasting, predicting and monitoring severe weather, and air quality. Data provided about ground conditions that can only come from sensors orbiting the planet helps agriculture, shipping, and other businesses.
“We have over 300,000 organizations using our software from almost every industry, and it’s used by most Fortune 500 companies,” said Sean Breyer, engineering director for the Living Atlas with Esri. “It maps information to support decision making.”
Esri doesn’t control the information, but it maintains the infrastructure to support the spatial format, he said. The Living Atlas does help to curate the most popular geospatial data and organizes the information around specific topics for easy use. Esri’s cloud-based ArcGIS infrastructure also provides computing power for users to perform their own analyses. Because the authoritative dataset creators retain control over their data, users can trust the accuracy and integrity of the results.
Data Expertise Not Required
Numerous forms of data paid for with tax dollars are available to anyone. They are scattered across government agencies tracking things as varied as road networks by the Department of Transportation and demographics by the Census Bureau. Scientific information is just as dispersed, housed in institutions across multiple countries. And the companies that could benefit don’t have the staff or computing power necessary to aggregate, sort, and analyze the information to extract only the pieces they need. “We take different datasets and roll them up into an app to make it really easy to use. You don’t have to be a data expert,” said Breyer.
The Living Atlas offers apps about some of the most common natural disasters, showing their impact on communities in the present and over time — Hurricane Aware, Wildfire Aware, and Drought Aware. Other apps provide different views of the Earth’s surface — Historical Topo Map Explorer, World Imagery Wayback App, and Community Maps Editor. Some satellites with popular data have their own apps — Landsat Explorer, Sentinel-1 Explorer, and Sentinel-2 Explorer.
If a company is thinking about purchasing land for a new building, entering the address into the Drought Aware App displays decades of data that can help determine if an arid landscape plan is best or if an irrigation system will be necessary to maintain the grounds. Esri technology was used to create the “layers” powering these apps by training AI-powered deep learning models on petabytes of NASA and other data. The result is an app that quickly presents a satellite image of the address, graphs drought data, and offers related information about the area such as water sources, agriculture, and the population accessing that water. The Living Atlas includes roughly 10,000 layers of information providing insights and information resources curated from about 25 million data layers shared by universities, scientists, and other entities, including NASA.
‘Amazing Stories’
Numerous satellites in low Earth orbit regularly transmit images and data collected by sensors updated daily or weekly. Some, like wildfire observations, are updated as often as every five minutes during the height of fire season. Esri has emergency management staff to help first responders and municipalities quickly access the local data they require. That’s because many of these organizations don’t have staff with data expertise to process the data NASA stores and prepares for use. The Earth Science mission includes helping end-users find what they need, said Katie Baynes, Earth data officer with NASA Headquarters in Washington.
“When we first started launching satellites and collecting information about Earth, we were primarily focusing on data for scientific research, study, and modeling by geophysical scientists,” she said. “But we realize that this data is also interesting to people who are building electrical grids or looking at infrastructure planning.”
NASA has more than 130 petabytes of data housed at 12 archive sites, including some from the first satellites launched in the 1960s, that weren’t easy to access for non-technical users. So NASA partnered with Esri and other companies to move the most in-demand information to the cloud (Spinoff 2023). The company continues to share important insights about the ever-changing priorities of its users. Baynes is charged with overseeing and setting strategic direction for the 35-year-old science data systems program, and she’s particularly pleased about the effort to introduce younger generations to this resource.
In addition to supporting multiple NASA programs and projects to manage their GIS data initiatives, Esri collaborates with the educational website My NASA Data to provide the ArcGIS StoryMap Collection and related lesson plans for teachers and students. “These are just amazing stories about how to explore the data, explain how to evaluate data, teaching students the basics of scientific inquiry,” said Baynes.
Counting Cars and Chlorophyll
A popular app Breyer highlighted uses satellite data to look for chlorophyll in the ocean as an indication of eutrophication, or lack of oxygen in the water, which impacts fishing practices, including recreational fishing. “We work specifically with people from the NASA biodiversity team to take the raw satellite data and process it into the useful chlorophyll thresholds around every country,” he said.
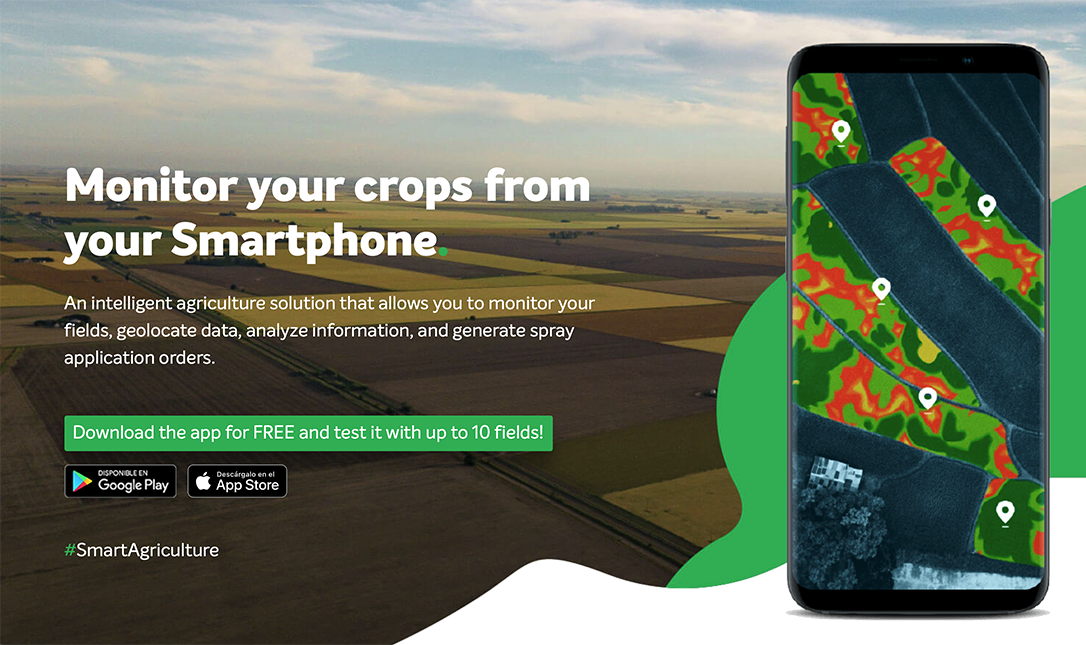
That data contained in the Living Atlas helps fisheries worldwide. Similarly, farmers can track moisture loss in fields and predict crop yields, while historic data about weather informs operations. Satellite data helps businesses count cars in a parking lot over time to identify shopping patterns and track weather to guide the placement of umbrellas or sunscreen near checkout lanes. Shipping companies can route goods and services based on the weather of the day and do long-term planning for shipping routes.
“It links directly back to NASA making that data available to our community in a ready-to-use format,” said Breyer. “Content from NASA is an important foundational piece of what we do in Living Atlas — sharing data in a way that is easy to use.”
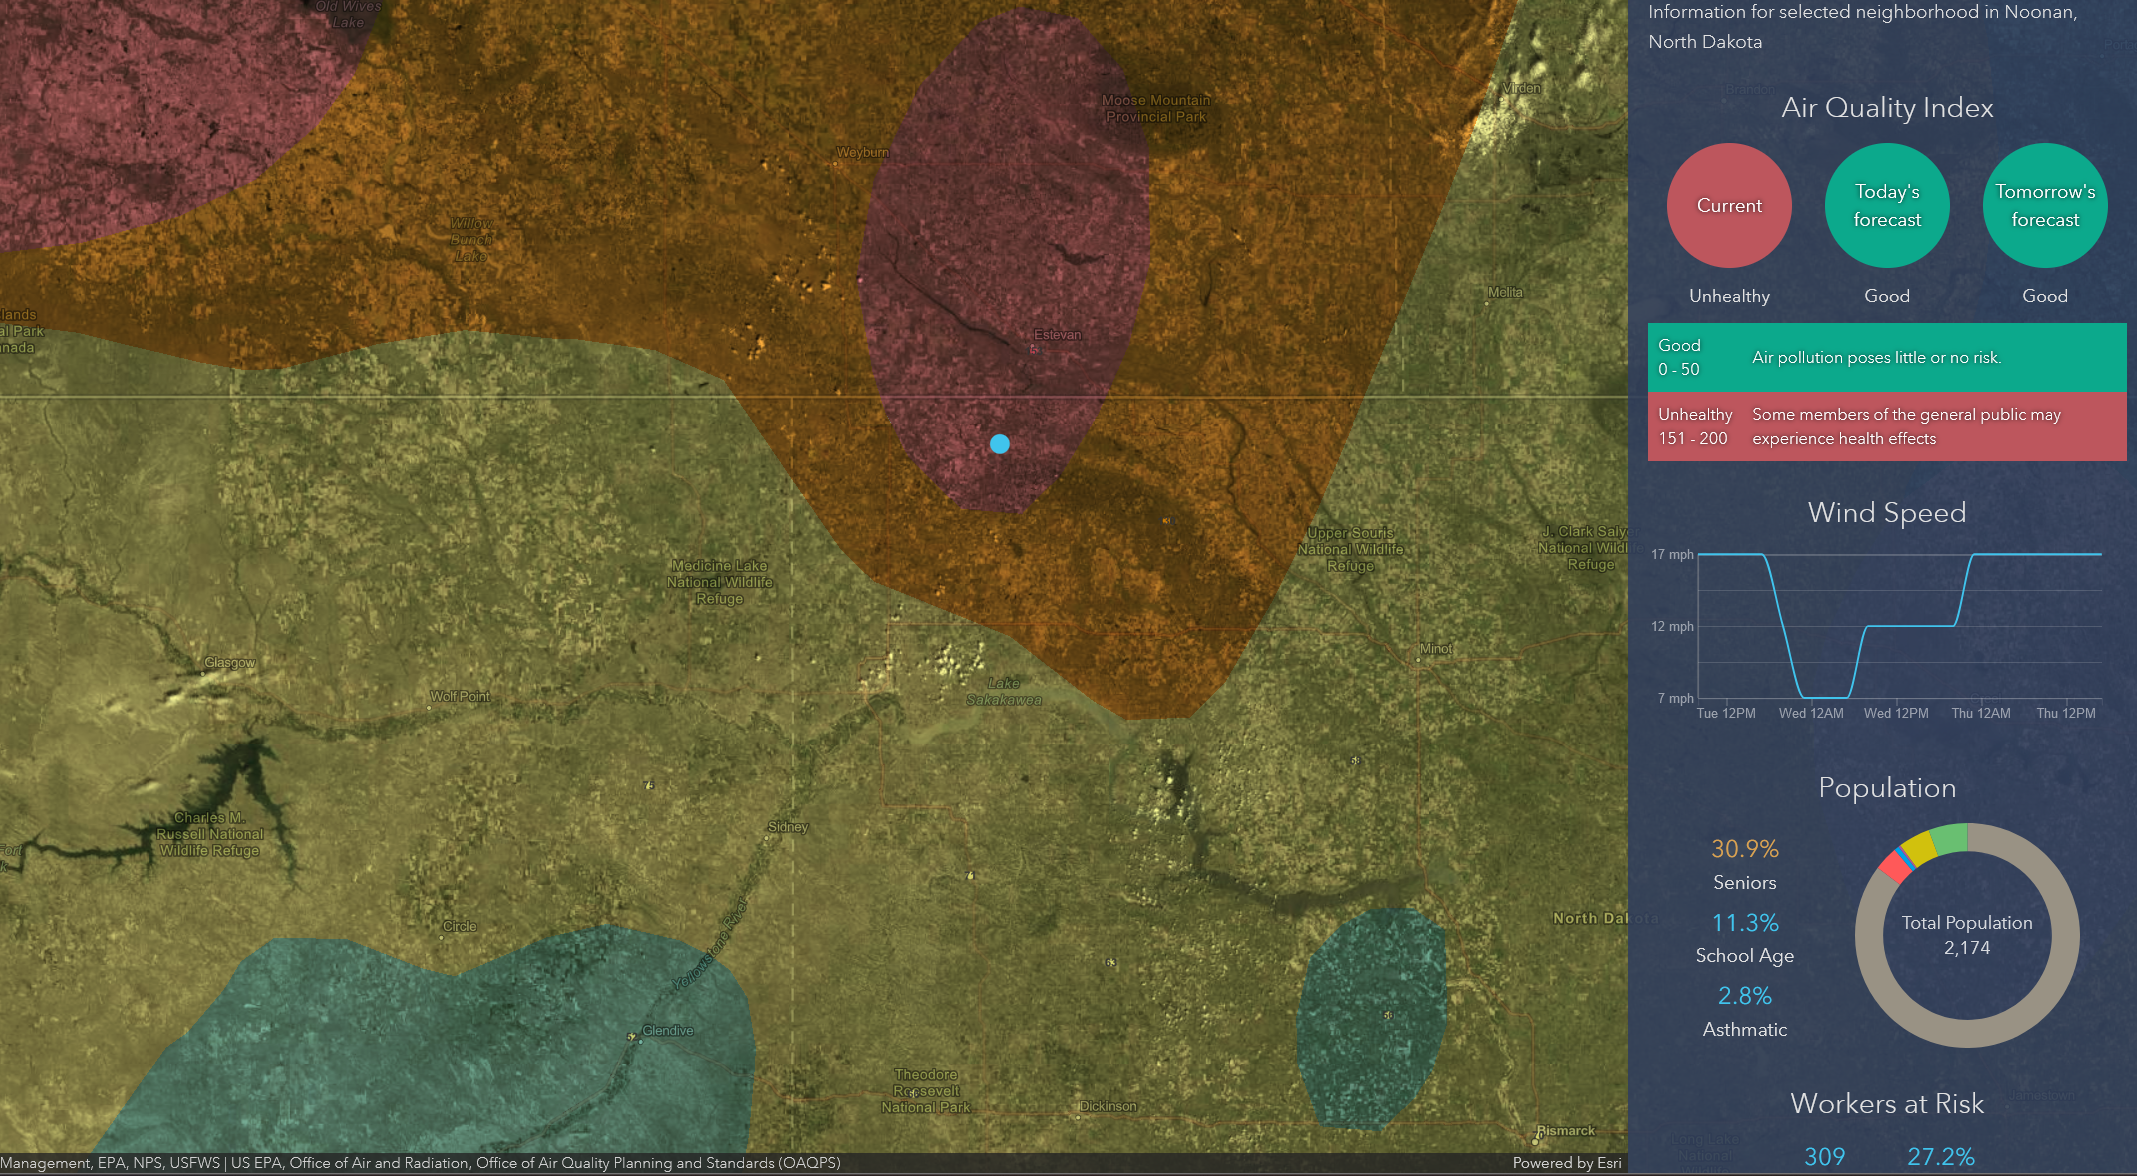
Esri’s Air Quality Aware app makes it possible for anyone to identify potential health risks. This map of Noonan, North Dakota, in June 2025 combines data from multiple sources, including NASA satellite data, to reveal the impact of smoke from wildfires burning in Canada. Credit: Esri Inc.
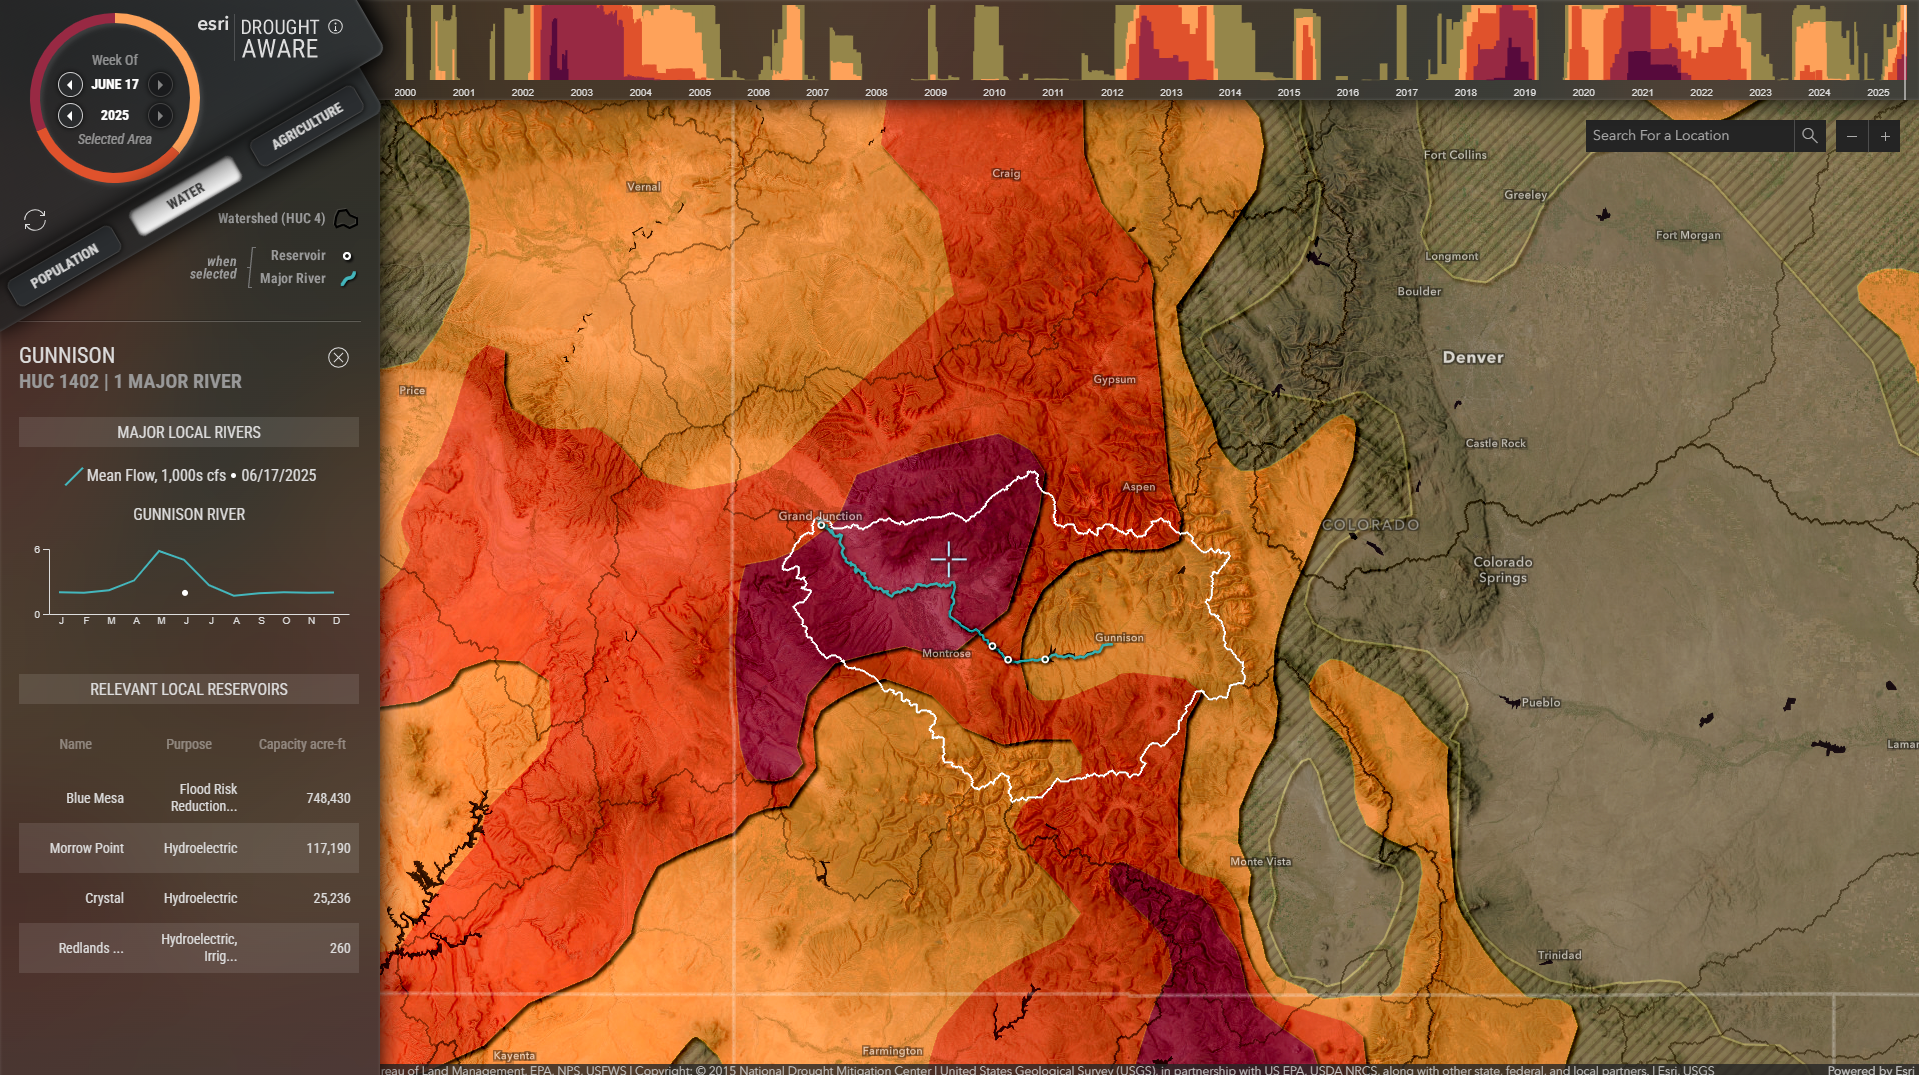
Does it seem like summers are drier than before? The Esri Drought Aware app compiles numerous sources of weather information with NASA satellite data to provide current information like this image of the Denver area along with local demographic data on the left and a long-term view of conditions across the top. Credit: Esri Inc.
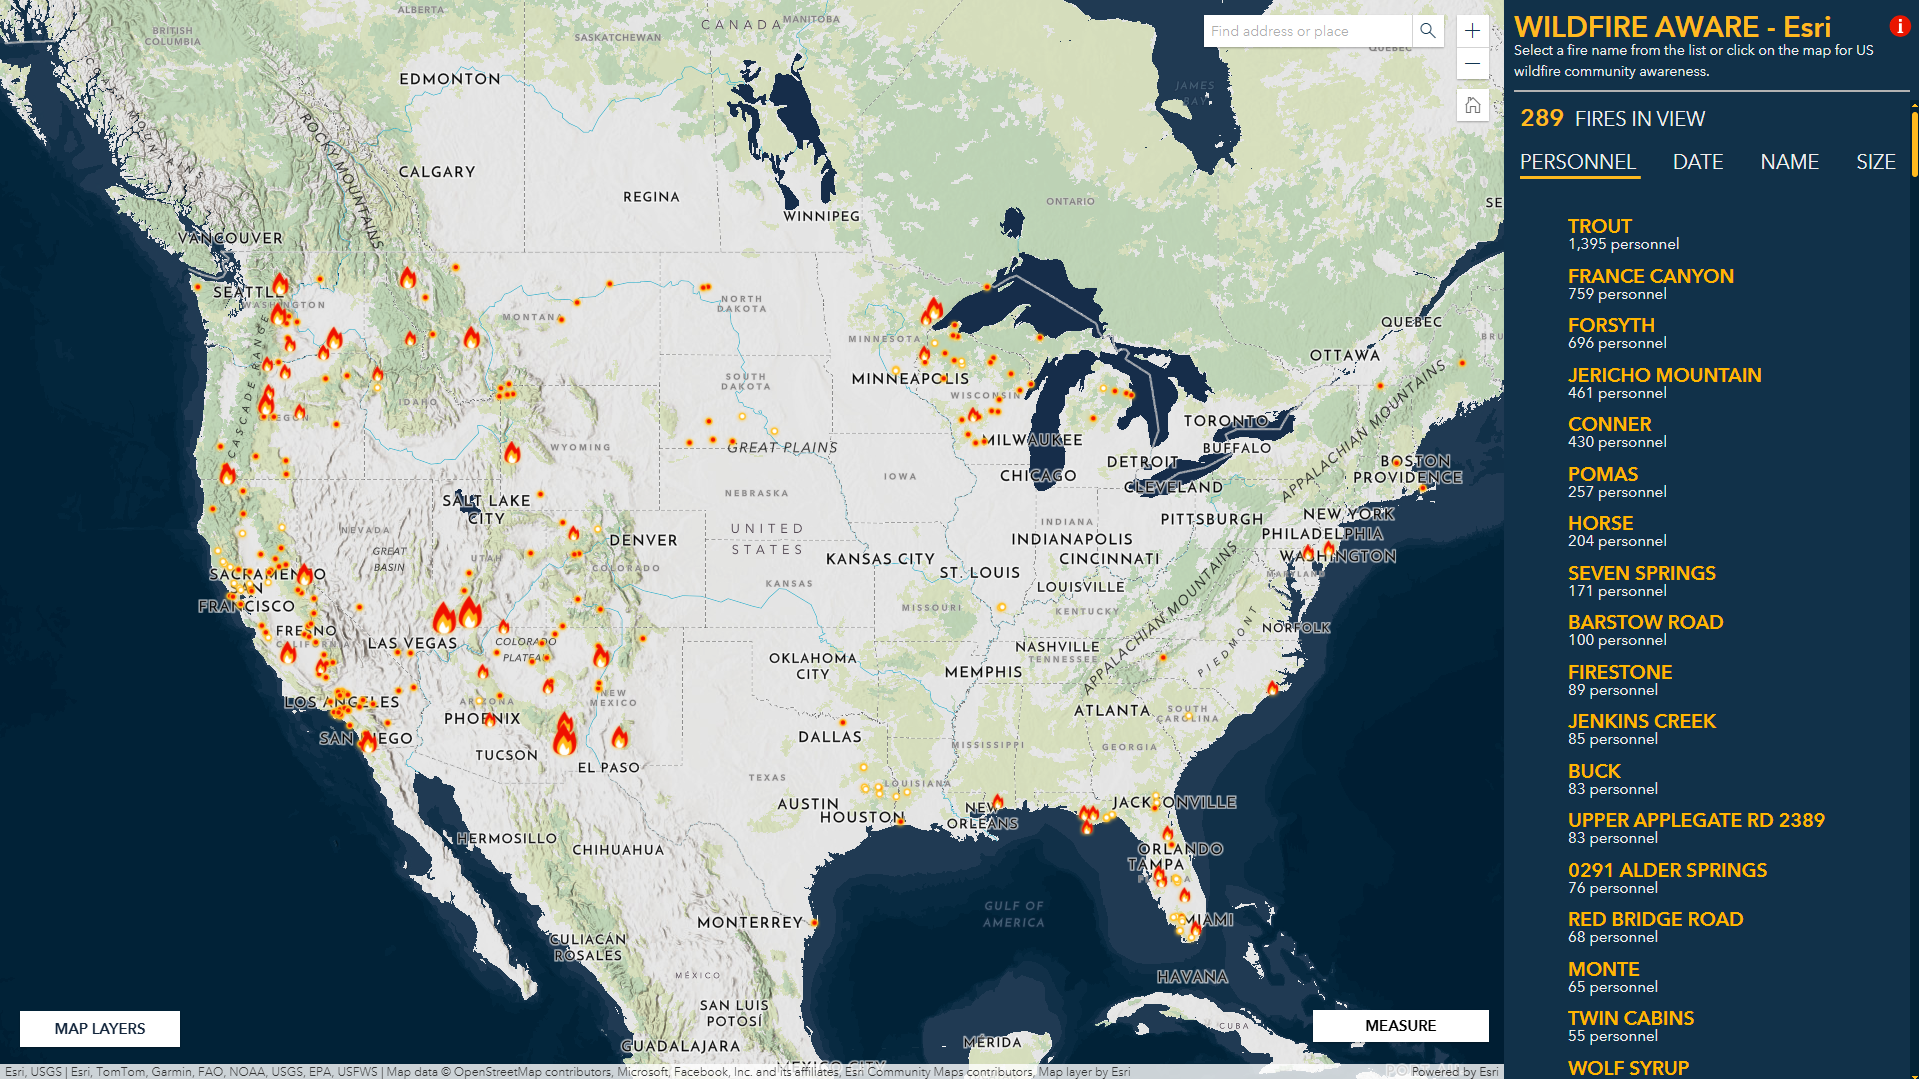
Anyone can track the locations of all wildfires in the United States at any time. Statistics about each one, including data drawn from NASA satellites, are available in Esri’s Fire Aware app. Credit: Esri Inc.
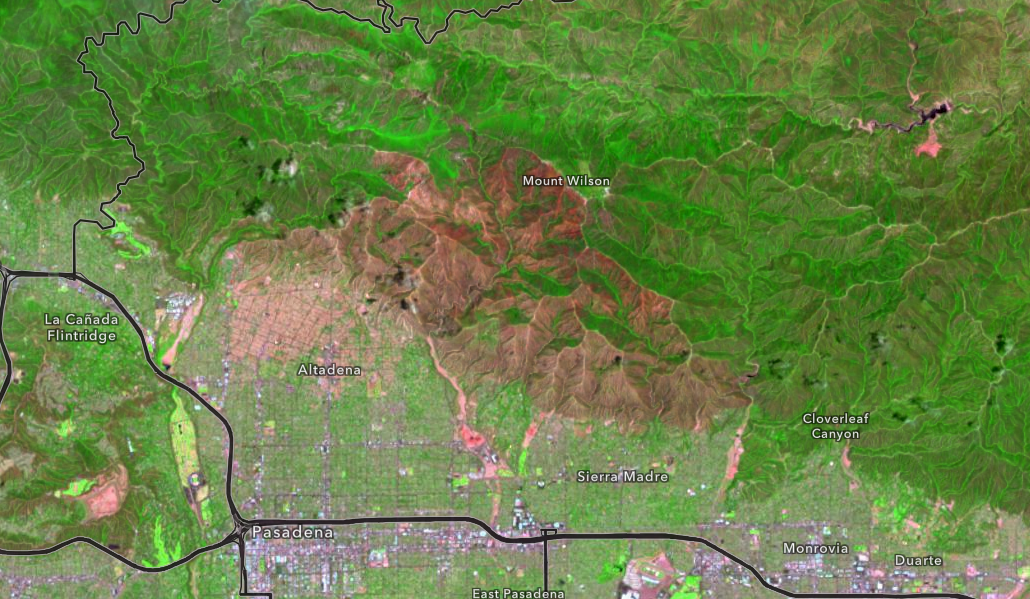
Esri’s Wildlife Aware app maps the damage done by wildfires, called burn scars, using Landsat data. This image of the 2025 Eaton fire, which burned 14,021 acres just northeast of Los Angeles, shows the extent of the burn scar – the brown area on Mount Wilson and extending into the Altadena community. Credit: Esri Inc.
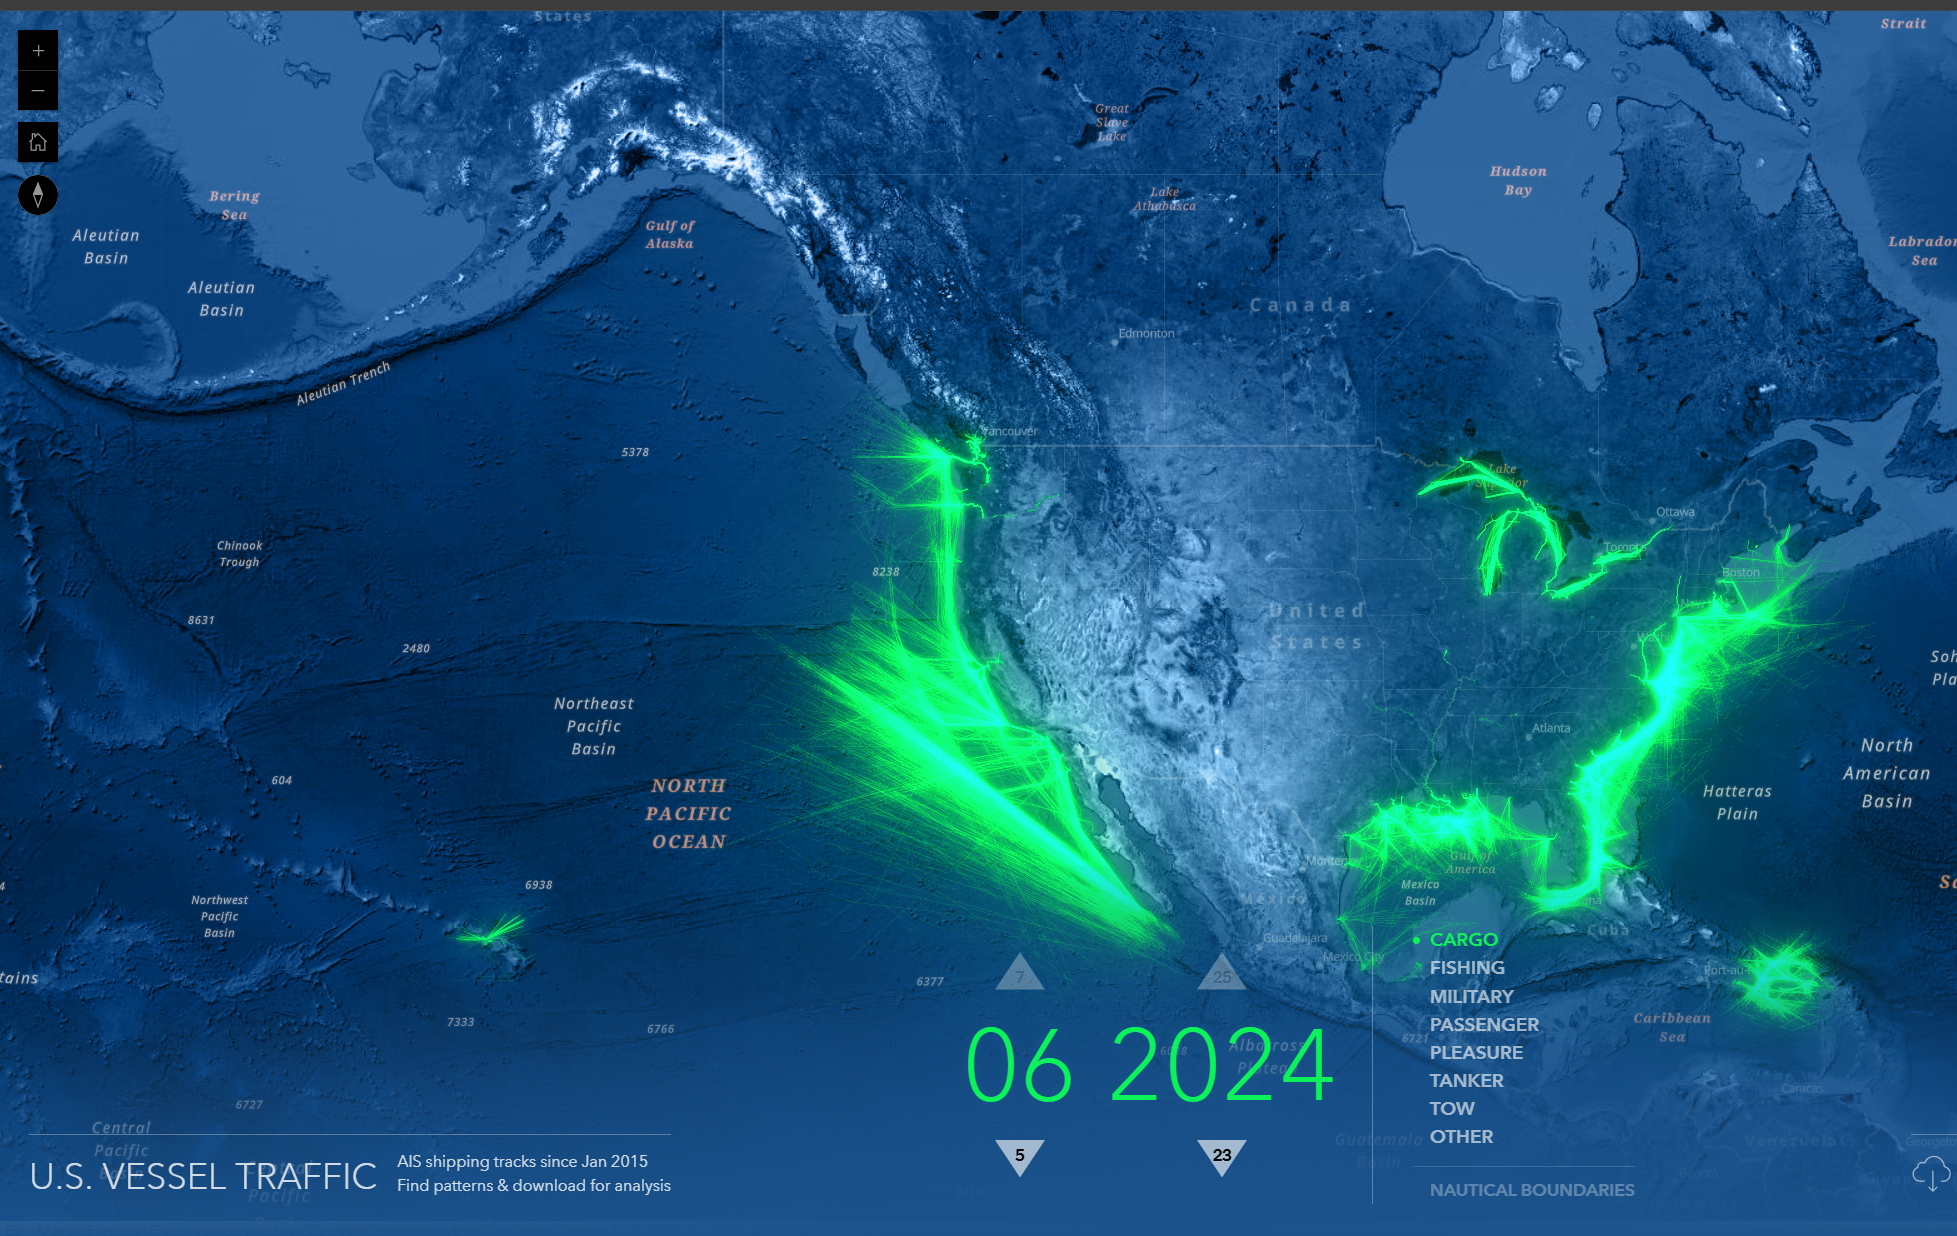
For companies coordinating marine shipping, Esri’s U.S. Vessel Tracking app provides invaluable data. NASA satellite data contributes to information about the movements of cargo, fishing, passenger, and other ships. Credit: Esri Inc.
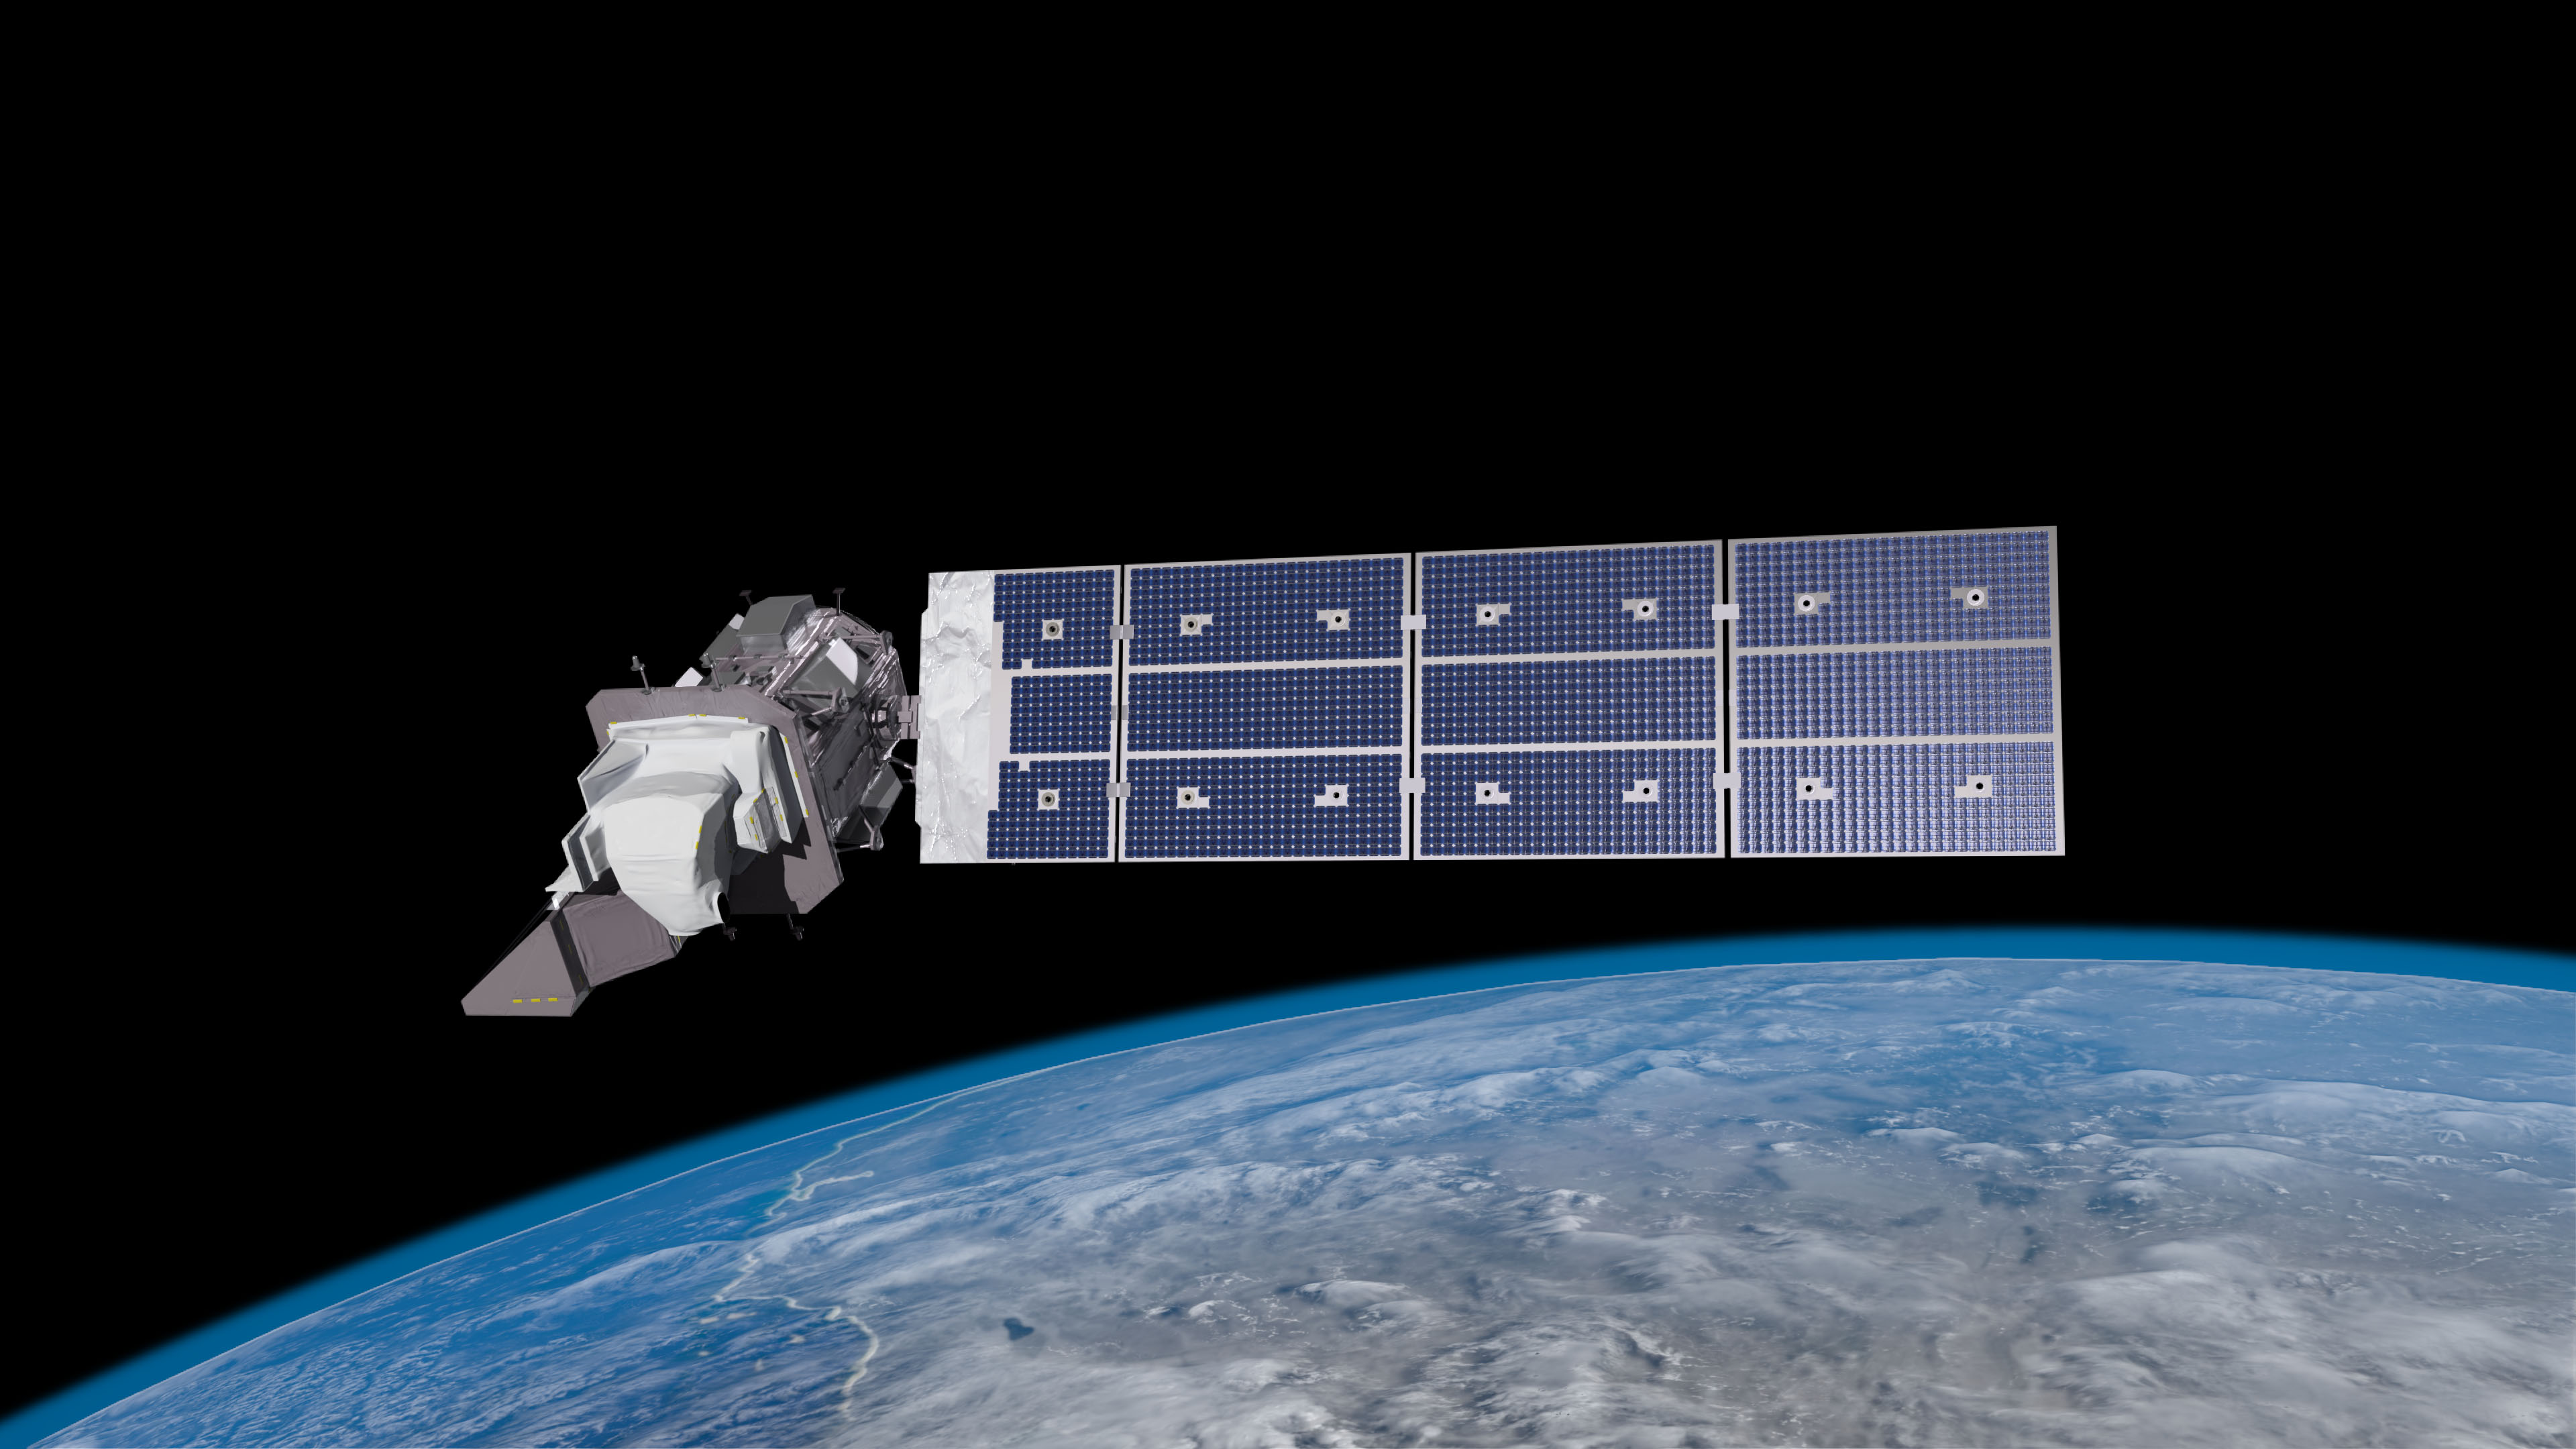
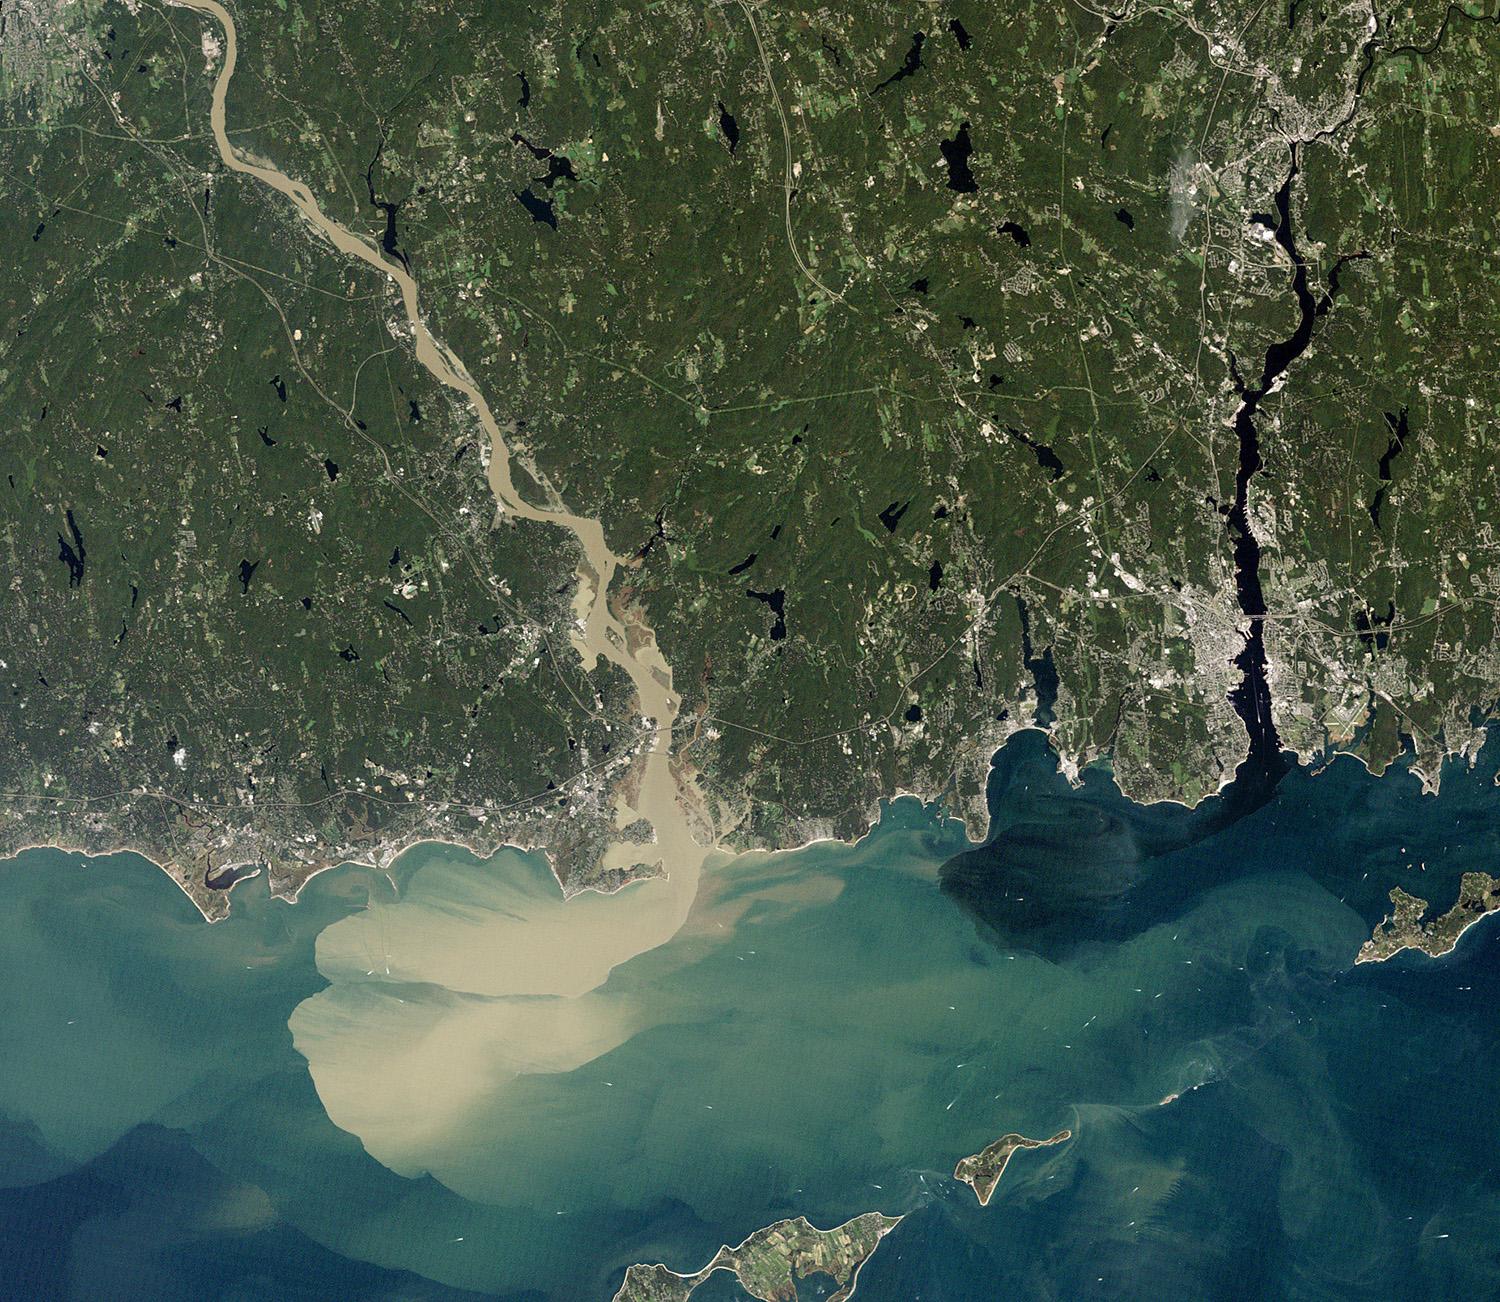
The long-running Landsat Earth-observation program provides Esri with a wealth of historical data. Free of charge to anyone, the NASA data is easy to access and analyze using the company’s Living Atlas apps. Credit: NASA
Esri’s Landsat Explorer app maps colorized surface temperatures, collected from Landsat and other satellites, for a portion of the Grand Canyon. The app allows users to build a map of data for any location around the world. Some popular locations like the Grand Canyon are packaged for easy access. Credit: Esri Inc.