

Shuttle Topography Data Inform Solar Power Analysis
NASA Technology
The next time you flip on a light switch, there’s a chance that you could be benefitting from data originally acquired during the Space Shuttle Program. An effort spearheaded by Jet Propulsion Laboratory (JPL) and the National Geospatial-Intelligence Agency (NGA) in 2000 put together the first near-global elevation map of the Earth ever assembled, which has found use in everything from 3D terrain maps to models that inform solar power production.
For the project, called the Shuttle Radar Topography Mission (SRTM), engineers at JPL designed a 60-meter mast that was fitted onto Shuttle Endeavour. Once deployed in space, an antenna attached to the end of the mast worked in combination with another antenna on the shuttle to simultaneously collect data from two perspectives. Just as having two eyes makes depth perception possible, the SRTM data sets could be combined to form an accurate picture of the Earth’s surface elevations—the first hight-detail, near-global elevation map ever assembled.
What made SRTM unique was not just its surface mapping capabilities but the completeness of the data it acquired. Over the course of 11 days, the shuttle orbited the Earth nearly 180 times, covering everything between the 60° north and 54° south latitudes, or roughly 80 percent of the world’s total landmass. Of that targeted land area, 95 percent was mapped at least twice, and 24 percent was mapped at least four times.
Following several years of processing, NASA released the data to the public in partnership with NGA. Robert Crippen, a member of the SRTM science team, says that the data have proven useful in a variety of fields. “Satellites have produced vast amounts of remote sensing data, which over the years have been mostly two-dimensional. But the Earth’s surface is three-dimensional. Detailed topographic data give us the means to visualize and analyze remote sensing data in their natural three-dimensional structure, facilitating a greater understanding of the features and processes taking place on Earth.”
Technology Transfer
Seeing the potential for elevation data to play a role in solar power modeling and planning, the California Public Utilities Commission asked Jan Kleissl, a professor of environmental engineering at the University of California San Diego, to use the SRTM data to build models showing how much shade an area on the ground receives given its horizon—that is, to what degree nearby terrain (such as a large hill) blocks out the sun during the day.
By identifying places prone to long periods either with or without direct sunlight, Kleissl’s data can assist people who are planning to build solar installations. “What we did was take the data and postprocess it, analyzing the elevations to simulate what the horizon would be for any place on the map,” says Kleissl. Horizon modeling proved a resource-consuming task, he says. “It’s a different metric than elevation, because you have to relate a given point to all of its surroundings.”
But with the modeling done, multiple parties expressed interest in the resulting product. “We weren’t the first ones to do this analysis,” says Kleissl, “but we were the first ones to do it on a large spatial area. We’ve covered the whole of Southern California and parts of the Bay Area. All of that is now a publicly available data set that we provide to anyone who is interested.”
Among the companies who acquired Kleissl’s data was New York City-based Locus Energy LLC. Locus Energy provides technology for analyzing and monitoring distributed solar installations; it offers historical, real-time, and forecasting information that helps power providers plan for and predict solar power production. The company draws the bulk of its data—mostly cloud formation and movement—using NASA’s geostationary operational environmental satellite system (GOES), or the weather satellites designed by NASA and operated by the National Oceanic and Atmospheric Administration.
Along with the data provided by GOES, the SRTM data that has been processed by Kleissl helps Locus Energy accurately determine how much solar energy is reaching a given location. Says Shawn Kerrigan, CTO of Locus Energy, “We combine these two data sets to model how much solar irradiance is hitting a particular location. The understanding that we’re developing with the help of NASA data, integrated with some of the knowledge and expertise we have, gives us some interesting insights into how much power is produced at distributed solar installations.”
Benefits
Locus Energy’s NASA-derived services have been incorporated into its Virtual Irradiance project—a software package that can estimate solar irradiance without the need for a physical sensor. “We deal with a lot of small- to mid-sized solar installations in distributed solar space,” says Kerrigan. “In order to understand how well their equipment is performing, these companies would otherwise have to install a sensor at each site. But it’s often prohibitively expensive to do so.”
As Kerrigan likes to say, Locus Energy “replaces expensive hardware with smarter software,” potentially bringing down the cost of solar energy as a whole. The savings offered merely by replacing those sensors with software is significant: Kerrigan says that a typical sensor might cost about $1,000 on average. “Our fleet consists of more than 130,000 monitored nodes, each of which would require its own sensor to acquire the information we can provide,” he says. Those savings only reflect the initial cost of purchasing sensors; companies stand to save even more in ongoing operation and maintenance costs.
According to the company, each set of data—historical, real-time, and forecasting—has a different value proposition. The historical data provides a basis for “solar prospecting,” or the process of determining which location would be most effective for deploying a solar system. Virtual Irradiance’s forecasting models use current cloud formation to develop a forward-looking picture of what cloud cover will be like to develop an accurate estimate of solar resource availability for the near future.
Kerrigan credits NASA’s SRTM and GOES data as an essential piece of what Locus Energy offers. “It’s fundamental to the modeling we’re doing. Without it, we literally would not be able to do our forecasting work,” he says. “And the same thing applies to the real-time and historical data we do. Without NASA data, we would have to rely on other weather models that are less effective. NASA’s technology is at the core of our technology.”
Virtual Irradiance™ is a trademark of Locus Energy LLC.
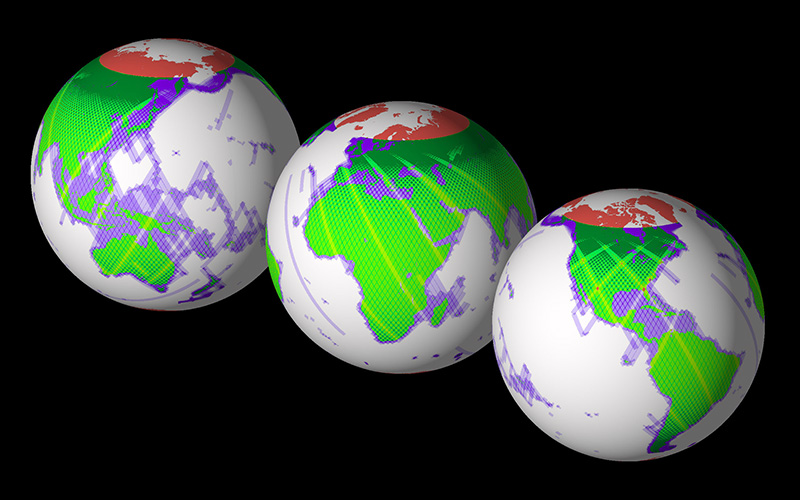
In nearly 180 orbits over 11 days, Shuttle Endeavour imaged more than 80 percent of the world’s landmass.
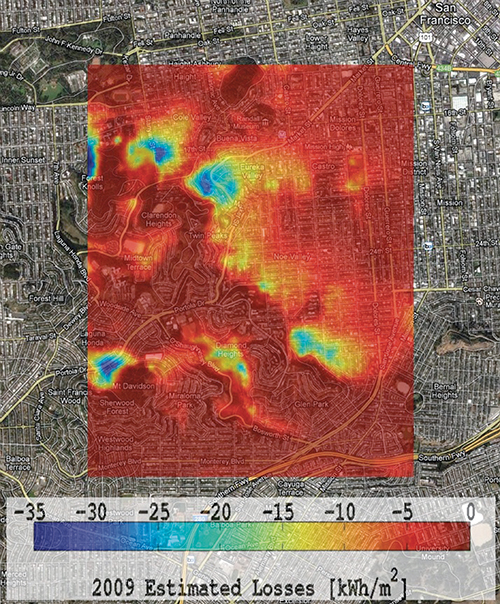
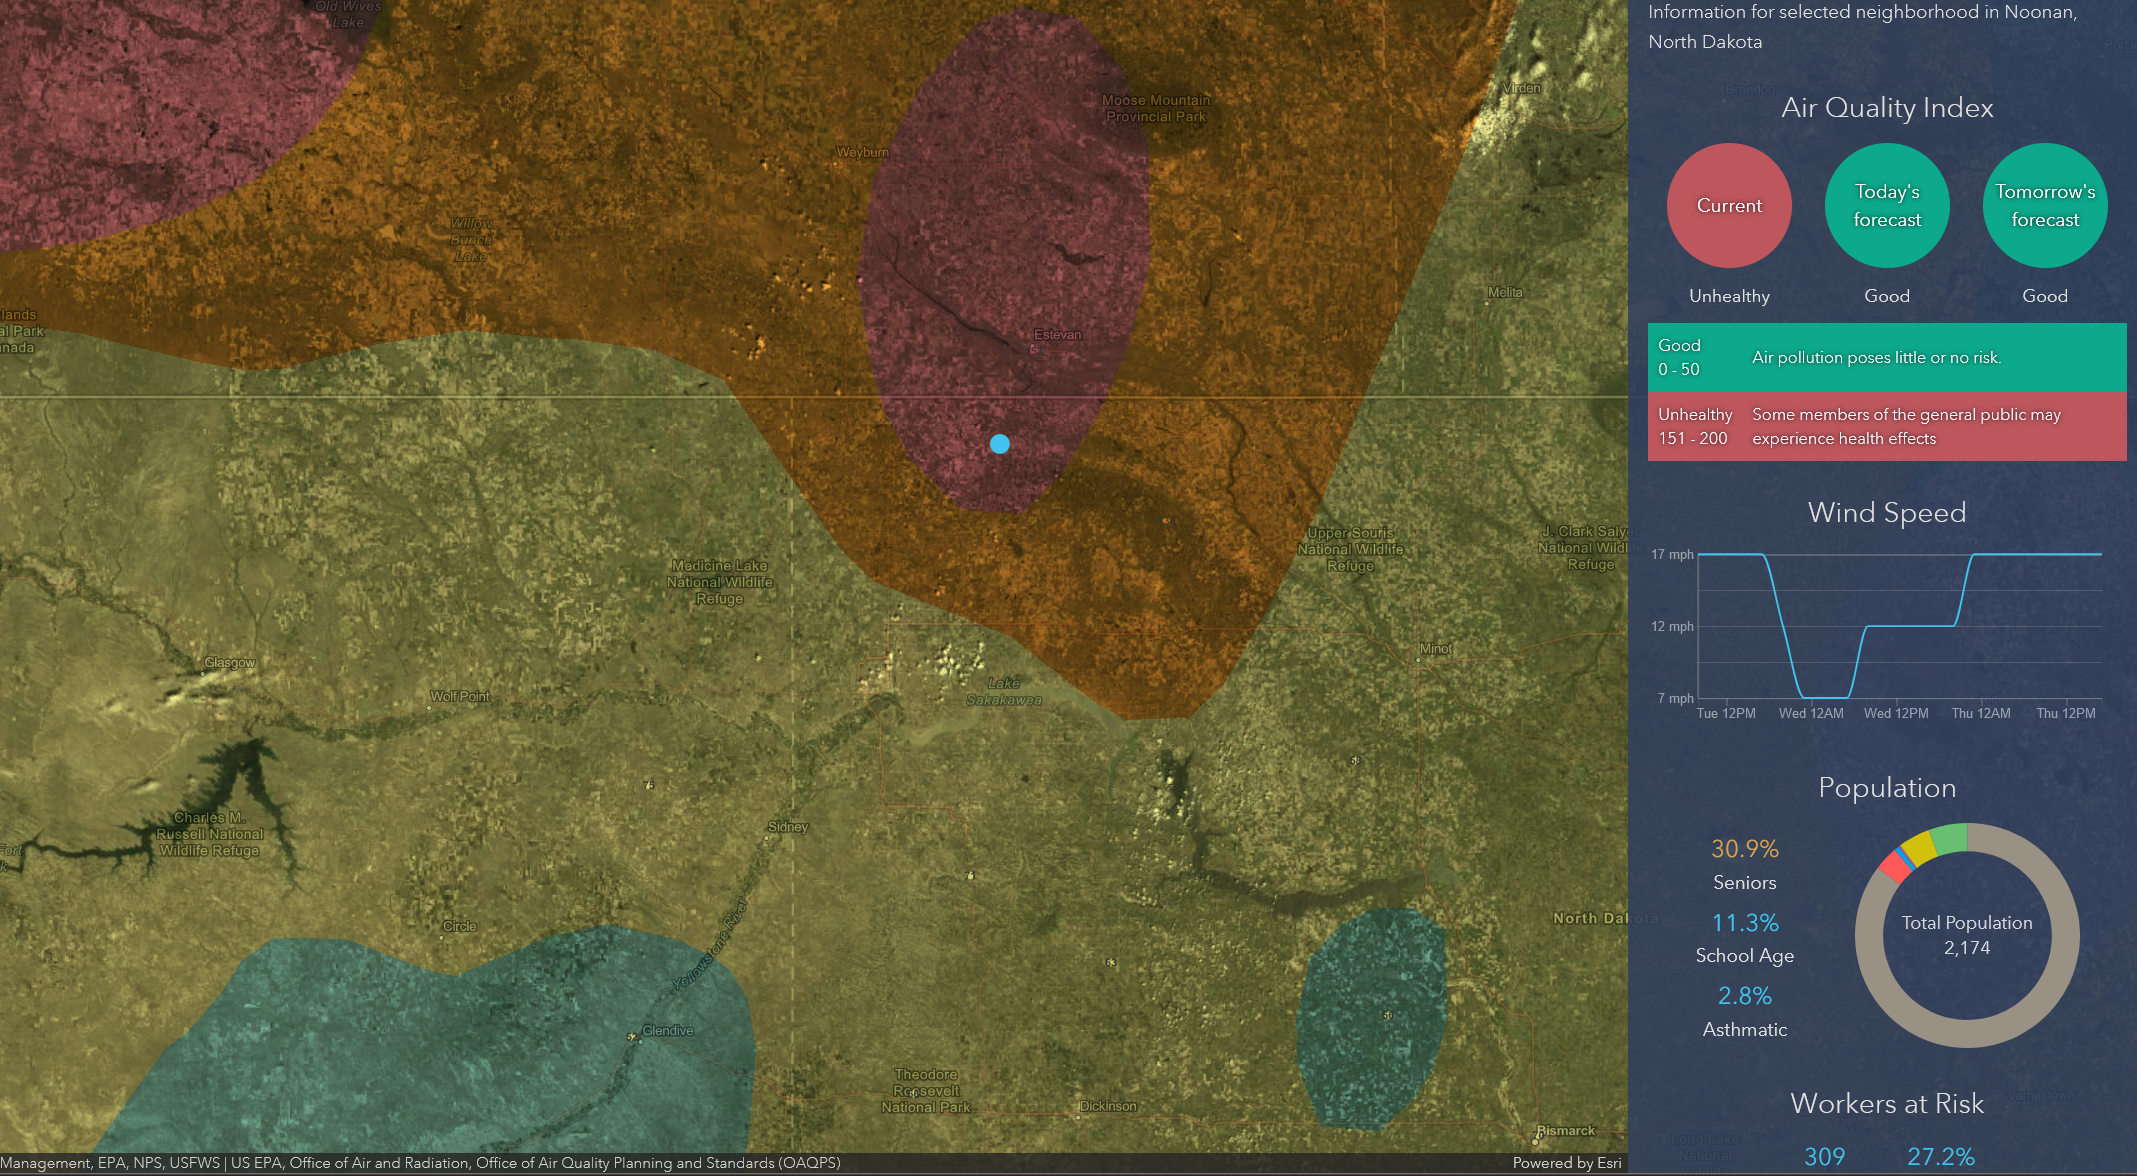
SRTM data helped construct shading models that can be overlaid on a Google Maps interface.
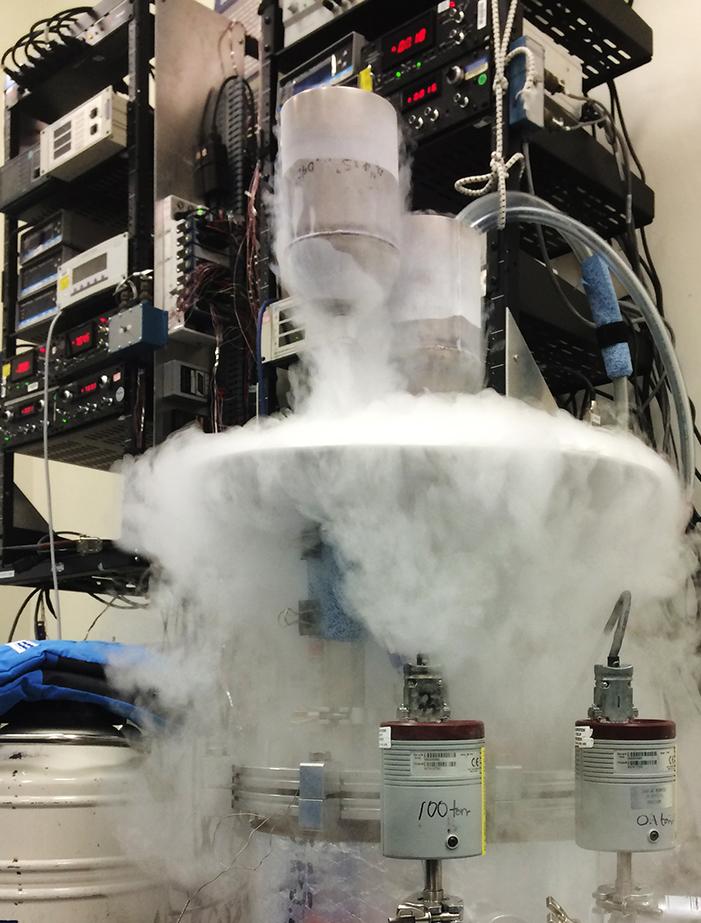
The 60-meter shuttle mast was deployed on STS-99.