
Interfaces Visualize Data for Airline Safety, Efficiency
NASA Technology
It was Henry Ford who said, “Anyone who stops learning is old, whether at 20 or 80. Anyone who keeps learning stays young.” Following such an adage, it’s safe to say that NASA will never grow old. From distant galaxies to Martian landscapes to Earthly atmospheres, the Agency never stops uncovering new information or learning about our universe.
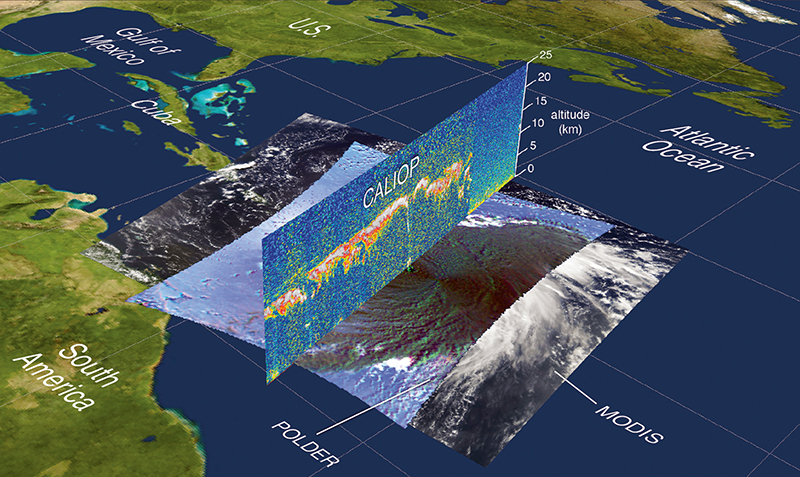
Take the group of six Earth-observing satellites known as the A-Train Constellation, launched by NASA and its international partners over the last couple of decades. Each satellite orbits the Earth one after another (like a set of cars on a train) to simultaneously measure clouds, aerosols, atmospheric chemistry, and other components. The data combine to paint a more complete picture of how the various atmospheric constituents interact with one another, and how the composition of the atmosphere affects Earth’s climate.
Near the middle of this group flies the Cloud-Aerosol Lidar and Infrared Pathfinder Satellite Observation (CALIPSO) satellite, a spacecraft that provides measurements of the altitude of aerosols and clouds in the atmosphere. Armed with new information from CALIPSO, scientists hope learn more about how clouds and aerosols regulate Earth’s weather, climate, and air quality.
As A-Train orbits and gathers data on what’s happening in the atmosphere, NASA scientists and Agency partners work on the ground to learn how to visualize, analyze, and communicate the information obtained from space.
Technology Transfer
In 2008, NASA’s Langley Research Center awarded Small Business Innovation Research (SBIR) funding to Fairfax, Virginia-based WxAnalyst Ltd. to construct a transparent user interface for Google Earth, a virtual globe system, to visualize data like that from CALIPSO. The partners wanted to devise a new capability for an interactive display of geographical data on top of the virtual globe.
WxAnalyst had already developed a prototype tool called WxAzygy. As Scott Shipley, the director of WxAnalyst, describes, “We wanted to be able to see exactly what is in the atmosphere—in real time, height, latitude, and longitude. We also wanted to make it so if you click on something in the air, Google Earth doesn’t think you are clicking on Texas. Instead, it knows you are clicking on the hurricane above it.”
Kurt Severance, a senior computer engineer at Langley, says NASA saw potential for visualizing data sets, like CALIPSO’s, in this way. “The technology could add scientific value to Google Earth,” he says. “NASA saw promise in adding this functionality—and that there would be a capability that a number of projects might be able to leverage to see data more clearly.”
Through the partnership, the WxAzygy user interface was further refined so users could see and work with the data where it was over Earth. When a user clicks or touches selected features above the surface, WxAzygy interprets the request.
After its Langley work, WxAnalyst proceeded to obtain additional funding from Goddard Space Flight Center’s SBIR program to use WxAzygy with COLLADA, a technology for 3D imaging, and Google Earth. After that, the company further improved its technology with the National Oceanic and Atmospheric Administration (NOAA).
Benefits
In 2009, while working with NASA and NOAA, Shipley received a phone call from the dispatch manager at Hawaiian Airlines, Mark Spence. Also owner of a small company called System Operations, Spence explained that Hawaiian was already using Google Earth in their dispatch operations, and that he was interested in what Shipley was doing.
“He said I was doing things that Hawaiian wanted to do in Google Earth,” says Shipley. “They were looking at four-dimensional things like volcanic ash plumes and cyclones, and they wanted to know where they were.”
Together, Spence and Shipley formed a joint venture company called WxOps. After providing a demonstration of WxAzygy on Google Earth to Hawaiian Airlines, the airline started using the software to help see four-dimensional data in the skies and route its planes accordingly. Now the technology helps the airline manage flights carrying over 6 million passengers a year from Hawaii to the western United States, the South Pacific, Australia, and Asia.
“Their dispatchers are in touch with their pilots all the time, and this system allows them to roll with the punches as conditions change,” says Shipley.
Spence says he and his team are able to make better business decisions based on business intelligence, due to real-time data, which also results in increased safety and fuel efficiency. In particular, the technology assists the airline in predicting turbulence, as well seeing where lightning is striking. According to Spence, current weather models correctly predict convection, frontal boundaries, tropical movement, icing, and turbulence approximately 70 percent of the time. Now, he says, “We can combine various data sets to get a better picture.”
Hawaiian Airlines is also benefiting by scheduling aircraft more precisely. In the winter of 2012, a storm was predicted to affect a flight from Honolulu to New York. After using WxAzygy, Spence released the flight. “We landed safely five hours after the last snowflake fell, while the other carriers cancelled flights,” he says. “It allowed us to operate when we might have been more reluctant, because I would have lacked the necessary business intelligence to make that decision.”
In the future, Spence and Shipley predict pilots will be able to use the technology onboard during flight to make decisions about where to go to avoid dangerous situations. Aside from airlines, Shipley is also working with a potential customer who wants to use the technology for radar data on NASA World Wind, a virtual globe system similar to Google Earth. Shipley is also exploring how to use the technology to visualize underground data. “It could be beneficial for geology educators and students, as well as valuable to industries such as mining and fracking,” he says.
The biggest challenge Shipley is currently facing is having too much good information. “We have over 50 data layers and it becomes unintelligible. We are trying different things to see what works. If you have 50 layers and point at something, what are you pointing at? Which layer?”
Whether for pilots, students, or scientists, one thing is certain: the technology will continue to inform people in beneficial new ways. In line with Ford’s idea, this NASA spinoff will help to keep people young. “NASA sees a lot of value in the dissemination of products using technology like this,” says Severance. “It helps people see that computer graphics can be used to gain a better understanding of natural phenomena.”
WxAzygy® is a registered trademark of WxAnalyst Ltd.
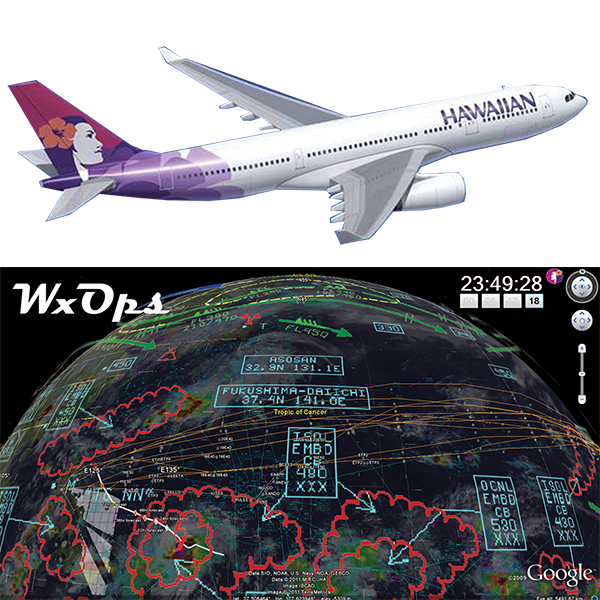
WxAnalyst created a user interface for Google Earth to visualize NASA satellite data. The company then worked with Hawaiian Airlines to show data about the skies to schedule commercial planes more precisely.
Data from various A-Train instruments provide a more complete picture of Hurricane Bill in 2009.