
Software Sleuth
Most people make mistakes and can usually just write them off as an accepted part of being human. NASA, however, must minimize the frequency and impact of errors by aggressively analyzing and fixing their root causes. Often this requires extensive investigation and detective work to track down what went wrong. Driven by the need to be error-free, NASA's Kennedy Space Center funded a Small Business Innovation Research (SBIR) contract with Prevision, Inc., to develop a Root Cause Analysis (RoCA) system.
Fair, Isaac & Co., Inc., uses predictive technology to provide customers with forward-thinking solutions to prevent mishaps before they happen. When complex systems fail, companies, especially manufacturers, want to be able to trace the problem to its source. More often than not, the mistakes are caused by human error. RoCA provides tools for entering investigation information and maintaining a database of mistakes, trends, and recommendations.
The system was developed for Kennedy to help track incidents and other events involving human errors during Space Shuttle ground processing. Although NASA has used similar systems in the past, RoCA helps organize the areas that may need additional training or other forms of preventive and corrective action. With all the inspections, maintenance and repairs that take place on each of the Space Shuttles between missions, tracking all the activity is quite a task. Sorting through the reports after a mistake has been made to determine the cause is even more daunting.
Using the RoCA system, investigation data can be stored, organized, and converted into detailed reports. When an event occurs, investigators are assigned to find the problems. The conclusions and analysis provided by the investigators are entered into a database. The updated database is placed on a shared network so other investigators can access the data to generate various reports. With each event accurately tracked in the database, RoCA can be used to detect trends, which can be entered in the database as a Trend Analysis. The database can also be used to track Recommendation Analyses conducted for individual events and trends.
Events are entered into the database with a variety of attributes associated with the incident. Information such as the event name, date, time, location, and a text description are all required to be entered into the database. Events are also comprised of two components, a Contribution Analysis and a Qualitative Analysis.
The Contribution Analysis lists the contributing factors, an associated cause code, and a contribution weight ranging between None-Low-Medium-High. The Qualitative Analysis breaks down complicated events into smaller pieces and specifies cause and time relationships. The resulting report provides a timeline of the events and a causal network diagramming how the components of the event worked together to lead to the mistake.
The RoCA system is divided into two separate applications: RoCA and RoCAReport. RoCA is used to manage the event database, describe events, store the analyses, and create reports. RoCAReport provides a more streamlined, easy-to-use, single-click method for accessing the major reporting features of RoCA.
Using the RoCA system, Fair, Isaac is able to help its customers find advanced decision-making solutions. Fair, Isaac expects that application of RoCA in the manufacturing industry would reduce costs and improve efficiency, by allowing for an examination of how to fix the anomalies captured in the production process.
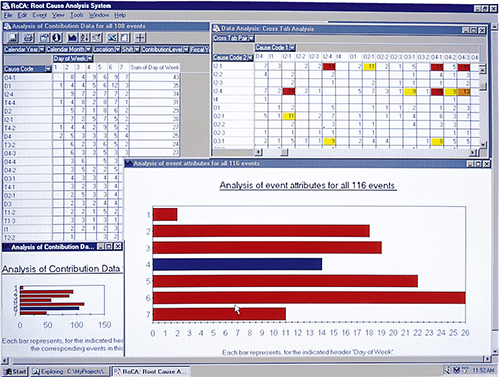
The RoCA data can be customized into reports that allow the user to readily identify underlying problem areas. Cross-tab and graphing abilities aid in the recognition of numerical data.